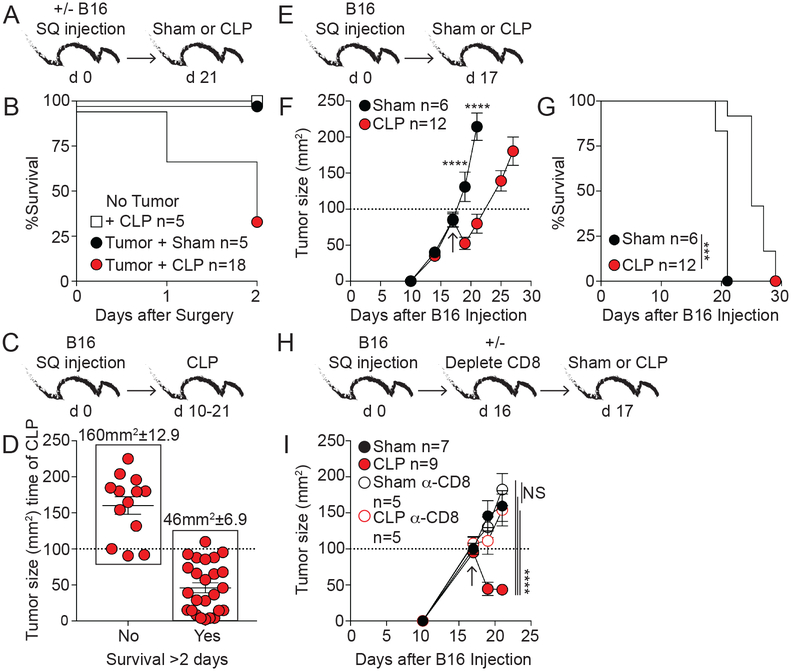
Fig 1. CD8 T cells contribute to slower tumor progression in sepsis survivors.
A) Experimental design. B) Survival after surgery. C) Experimental design; 10 to 21 days after tumor injection CLP surgery was performed. D) Mice were separated into survivors and non-survivors 2 days after surgery and tumor size (mm2) at the time of CLP induction for each mouse is shown. Average tumor size (mm2) is indicated above. E) Experimental design. F) Tumor size (mm2) at indicated time points after B16 injection. Arrow indicates time of surgery. G) Survival. H) Experimental design. One day before surgery mice were treated with 800μg αCD8 or rat IgG mAb. I) Tumor size (mm2). Arrow indicates time of surgery. Tumor volumes ±SEM are shown. Tumor growth and survival curves analyzed using two-way ANOVA and Log-rank (Mantel-Cox) tests, respectively. NS=not significant, ***p<0.001, ****p<0.0001. Data in panels A-D are pooled from at least 2 independent experiments; E-G are representative of greater than 13 independent experiments; H-I representative of 2 independent experiments.

