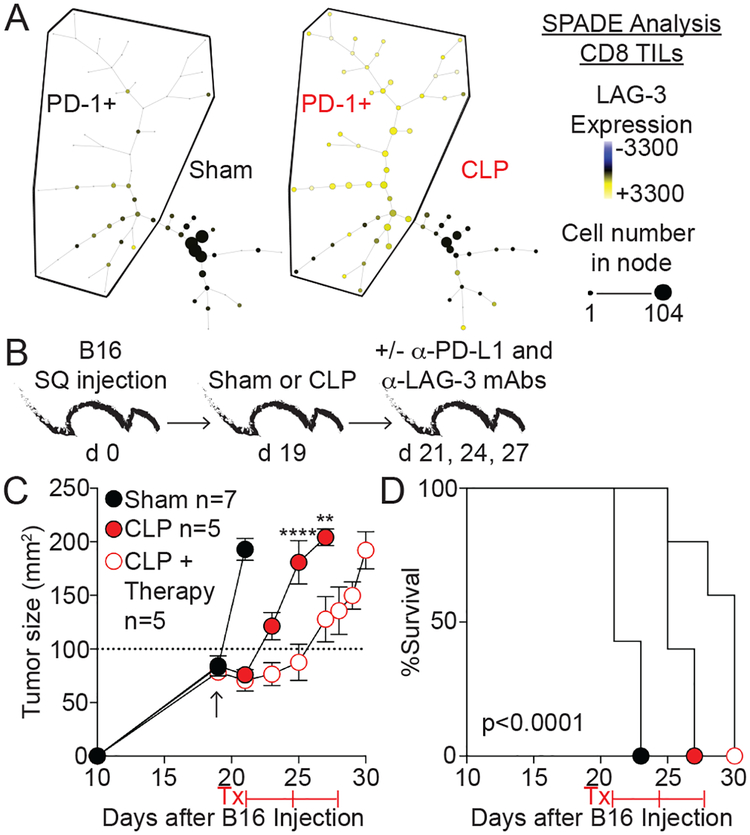
Fig 4. PD-1 and LAG-3 blockade further reduces tumor progression after sepsis.
A) Representative SPADE trees of CD8 TILs 3 days after sham or CLP surgery was performed on mice that received 2×10⁴ B16 cells 17 days earlier. PD-1 expressing cells are shown in the PD-1+ bubble. In an unbiased approach, cells sharing similar characteristics are grouped into nodes. Relative expression of LAG-3 is shown based on node color (Blue-Yellow). Node size indicates the number of cells. B) Mice received 2×10⁴ B16 cells SQ and 19 days later underwent surgery. 2 days later therapy mice received αPD-L1 and αLAG-3 or rat IgG control Ab every 3 days. C) Tumor size (mm2). Arrow indicates time of surgery. D) Survival. Tumor growth and survival curves analyzed using two-way ANOVA and Log-rank (Mantel-Cox) tests, respectively. **p<0.01, ****p<0.0001.

