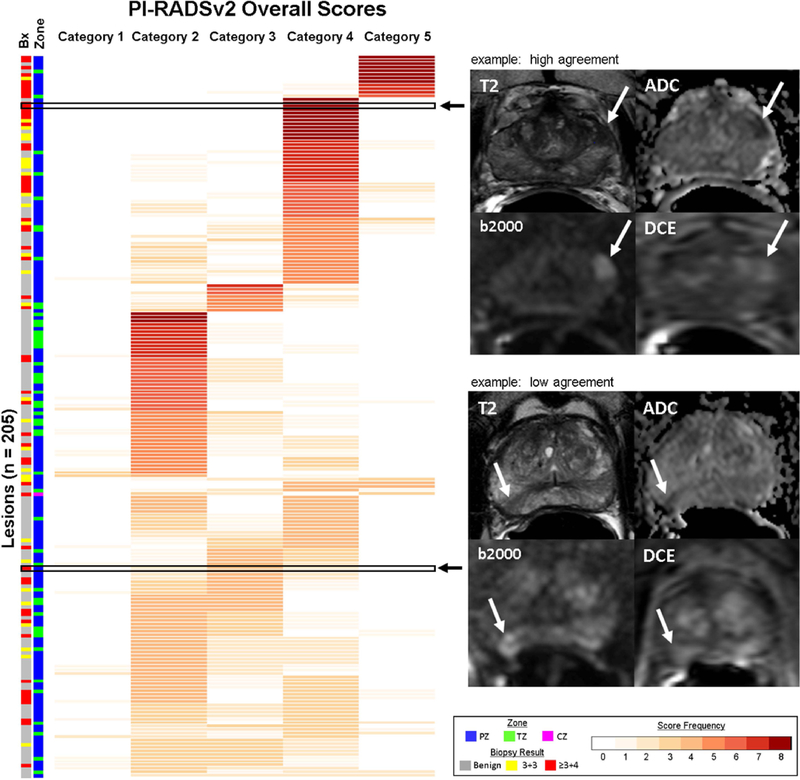
Figure 2. Overall PI-RADSv2 scoring distribution chart.

Each lesion (n=205) represented as a row with the frequency of scores reported for PI-RADSv2 categories. Lesions with consistent scoring, indicating high agreement, are represented by darker shades of red (max count = 4 readers x 2 rounds = 8). Lesions with poor agreement in scoring demonstrate lower frequencies across multiple PI-RADSv2 scoring categories. Two representative examples demonstrating high and low scoring agreement are shown with T2-weighted (T2), ADC, high b-value DWI (b2000) and DCE pulse sequences. Top – high agreement: A left base anterior peripheral zone lesion (Gleason Score 3+4 = 7) with reproducible scoring, in which all 4 readers assigned PI-RADSv2 Category 4 in both rounds. Bottom – low agreement: A right apical-mid peripheral zone lesion (Gleason Score 3+4 = 7) showing poor consensus, with two PI-RADSv2 Category 2 scores, four PI-RADSv2 Category 3 scores, and two PI-RADSv2 Category 4 scores. Two readers reported the same score in both rounds (Reader 1 PI-RADSv2 score 3, Reader 4 PI-RADSv2 score 2), with other readers demonstrating inconsistent scoring between round 1 and round 2. Prostate zonal location of each lesion and targeted biopsy results are indicated along the left side of the figure. PZ = peripheral zone, TZ = transition zone, and CZ = central zone.
