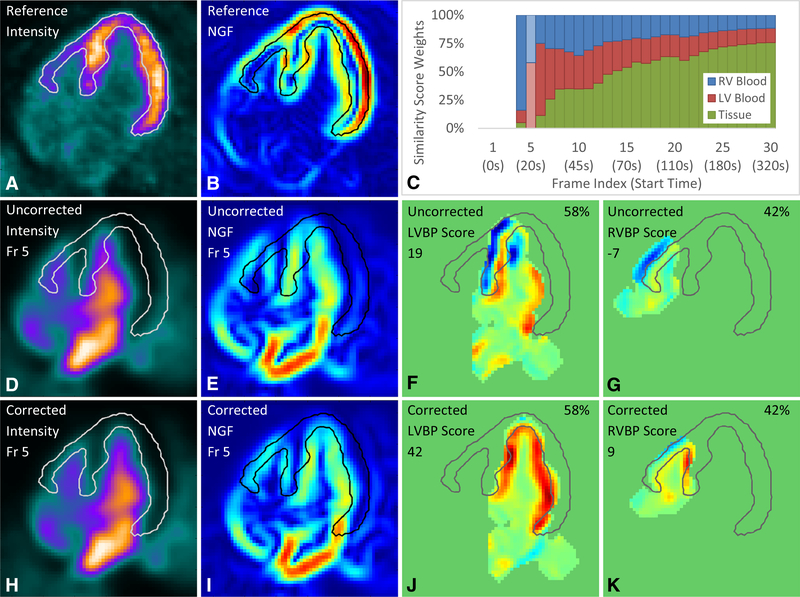
Figure 2.
Automated motion correction example in the (D-K) blood phase with (A-B) reference image volume and (C) similarity score weights. Similarity scores vary from high (red) to low (blue). The frame selected is highlighted (lighter shade) in the similarity score weights plot (C). NGF indicates normalized gradient field; Fr, frame; LV, left ventricle; RV, right ventricle; LVBP, left ventricular blood pool; RVBP, right ventricular blood pool.

