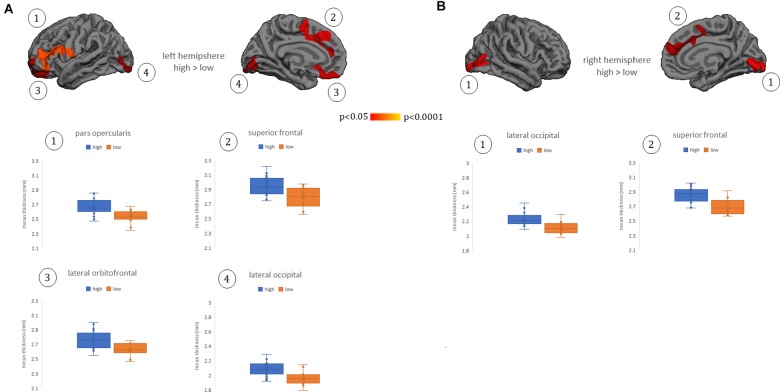
FIGURE 1.
Cortical thickness differences between groups of low and high empathy within the Perspective Taking subscale. (A) left hemisphere. (B) right hemisphere. Numbers indicate each cluster of significance that in turn are plotted below the cortical maps. Results were corrected using Monte Carlo simulation at two-tailed p < 0.05. Color maps indicate significant cortical thickening in the high group compared with the low group. Boxplots show the mean thickness values of each participant within the clusters that reached significant differences between groups. Vocabulary test scores were used as a covariate. The box of the graphs indicates the second and third quartile and middle lines are medians.

