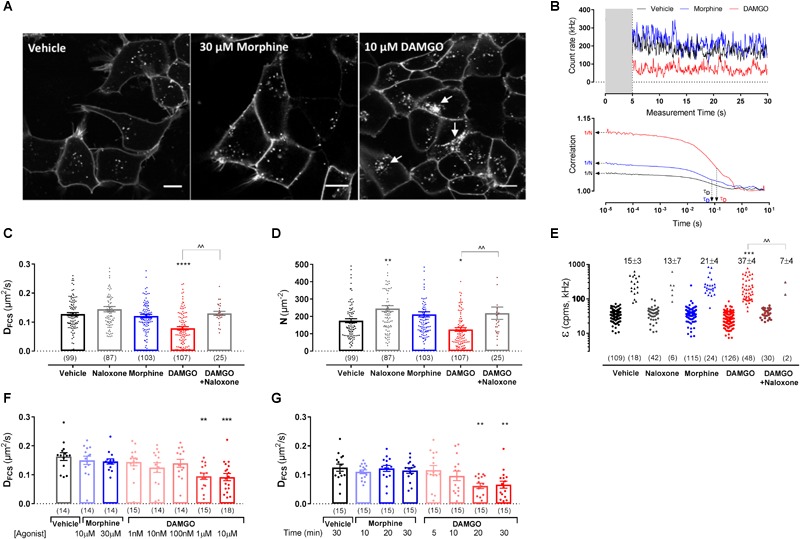
FIGURE 2.

Fluorescence correlation spectroscopy measurements in HEK293 SNAP-MOP cells following ligand stimulation. (A) Representative images from HEK293 SNAP-MOP cells labeled with SNAP-Surface 488 (BG-488) dye after stimulation with vehicle, 30 μM morphine or 10 μM DAMGO for 20 min. Scale bar 10 μm; arrows represent agonist-induced internalization. (B) Representative FCS traces from single HEK293 SNAP-MOP cells after stimulation with vehicle, 30 μM morphine, or 10 μM DAMGO for 20 min (gray area indicates the initial 5 s of data that were removed, see section “Materials and Methods”), and their corresponding AC fit indicating N and τD of SNAP-MOP. (C) Diffusion coefficient of SNAP-MOP upon stimulation with 30 μM naloxone, 30 μM morphine, 10 μM DAMGO (20 min, 37°C), or 10 μM DAMGO after pre-treatment with 30 μM naloxone (30 min, 37°C) (n = 25–107 cells from 5 to 23 independent experiments; one-way ANOVA, F(df1,df2): F(4,416) = 15.04, P < 0.0001). (D) Particle number of SNAP-MOP upon stimulation with 30 μM naloxone, 30 μM morphine, 10 μM DAMGO (20 min, 37°C), or 10 μM DAMGO after pre-treatment with 30 μM naloxone (30 min, 37°C) (n = 25–107 cells from a minimum of 5 independent experiments; F(4,416) = 11.06, P < 0.0001). (E) Molecular brightness of SNAP-MOP after stimulation with 30 μM naloxone, 30 μM morphine, 10 μM DAMGO, or 10 μM DAMGO after pre-treatment with 30 μM naloxone. For each condition, brightness values for the first (left) and second (right) component are shown [n = 30–126 cells from a minimum of 6 independent experiments; F(4,82) = 5.74, P < 0.0001], with the percentage of cells requiring a two-component fit annotated. (F) Diffusion coefficient of SNAP-MOP upon increasing concentration of morphine or DAMGO after 20 min incubation [n = 14–18 cells from 3 independent experiments; F(7,110) = 4.14, P < 0.0001]. (G) Diffusion coefficient of SNAP-MOP upon stimulation with 30 μM morphine or 10 μM DAMGO with increasing time incubation periods [n = 15 from 3 independent experiments; F(7,113) = 4.36, P = 0.0003]. Each data point on the scatter plots represents a measurement from an individual cell (number of cells in parenthesis) and column plots represent mean ± SEM of the indicated number of cells. ∗ denotes significance vs. vehicle treatment and ∧ denotes significance vs. DAMGO control in one-way ANOVA with Sidak’s multiple comparisons test (∗P < 0.05, ∗∗P < 0.01, ∗∗∗P < 0.001, ∗∗∗∗P < 0.0001, ∧∧P < 0.01).
