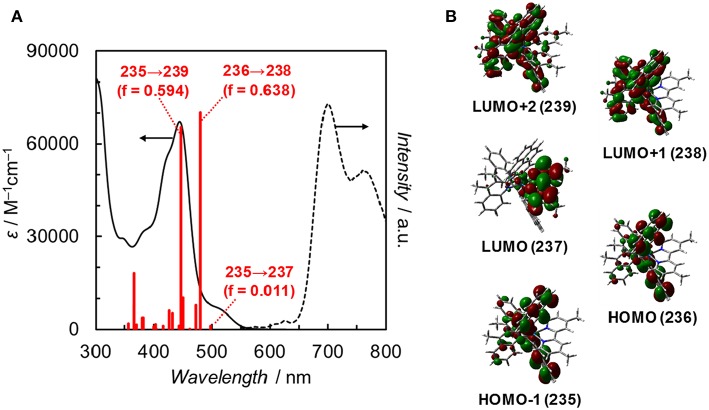
Figure 4.
(A) UV–vis absorption spectrum (solid line), TDDFT theoretical excitations (red bars, >350 nm, f: oscillator strength), and emission spectrum (dotted line) of Ir(pyr) in DMA at 298 K. (B) Frontier orbitals of Ir(pyr). Calculation method: B3LYP/LANL2DZ(Ir)/6-31G(d,p) (H, C, N) levels by using polarizable continuum model (PCM) with the default for DMA, isovalue = 0.02.

