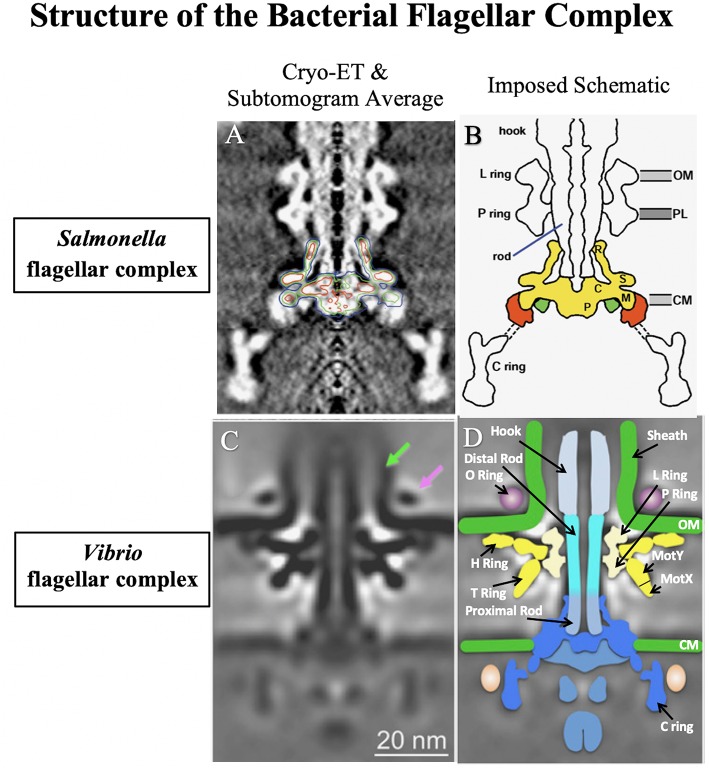
Figure 1.
A comparison of the well-studied Salmonella enterica serovar Typhimurium flagellar complex (Suzuki et al., 2004) to that of Vibrio alginolyticus (Zhu et al., 2017). The flagellar complex was imaged using cryoelectron tomography (Cryo-ET) combined with genetic subtomogram analysis. Final reconstructed images were generated via superimposed density maps. (A) Electron microscopy rendering of the S. Typhimurium flagellar complex with the basal body outlined. (B) Schematic of the S. Typhimurium flagellar complex. (C) Electron microscopy rendering of the sheathed V. alginolyticus flagellar complex. Vibrio specific attributes are depicted by arrows: the sheath (green arrow) and the O ring (purple arrow). (D) Schematic of the sheathed V. alginolyticus flagellar complex. Images reproduced and modified with permission.

