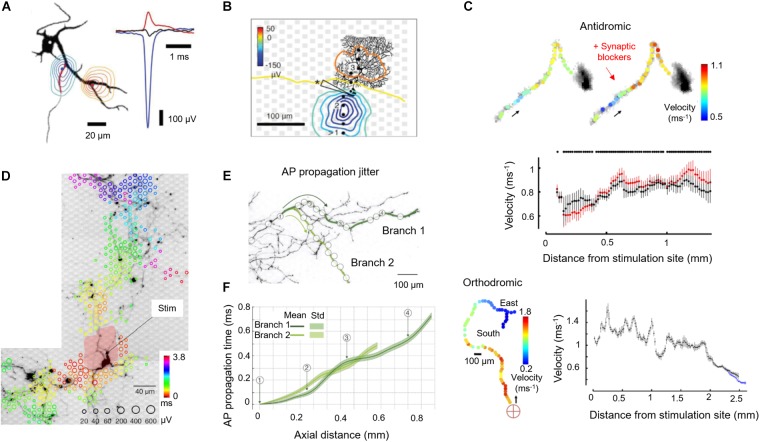
FIGURE 2.
Application of HD-MEAs to study axon neurobiology. (A) (Left) Contour plots of the minimum (blue) or maximum (red) extracellular-action-potential (EAP) signal within ± 500 μs of the negative peak. The AIS has been marked on the MAP2 fluorescence image in the background (black) with a red line (ankyrin-G staining). The contours have been normalized to the largest negative signal (blue-to-green) or the largest positive signal (red-to-yellow), see right panel. (Right) The largest negative (blue) and positive EAP signals (red) along with the somatic potentials (black) are shown as peaks. (B) Spatial distribution of the averaged spontaneous EAP of a Purkinje cell (PC). The largest EAP amplitudes were found along the axon of the PC. (C) (Top) Velocity profiles (color) along the propagation pathway without (left) and with (right) application of synaptic blockers. Arrows indicate the antidromic propagation direction. (Middle) Velocities without (black) and with (red) application of synaptic blockers calculated by using a bootstrapping procedure. (Bottom) The same analysis was performed for an orthodromic action potential. The red cross indicates the stimulation electrode located near the soma. Propagation continued into two branches (“East” and “South”). (D) Stimulation-triggered EAP footprint superimposed with neuronal morphology, revealed by live-cell imaging using lipofection. Circle sizes indicate logarithmically scaled amplitudes of triggered APs, whereas colors indicate the occurrence times of the negative AP peaks relative to the stimulation time. The black arrow points to the stimulation electrode for orthodromic stimulation, whereas the pale red patch indicates the area affected by the stimulation artifact. (E) Two axonal branches, labeled “Branch 1” and “Branch 2,” are marked by dark-green and light-green lines on a fluorescence image. White circles indicate the positions of the used recording electrodes. (F) AP propagation times obtained from the two branches: average propagation times are presented by solid lines; the standard deviations of the propagation times are represented by the pale bands in the background. Except Panel B, which is an acute cerebellar slice preparation, all other panels refer to cortical neuronal cultures. Images have been adapted with permissions from Bakkum et al., 2013, 2018 (A–C), Radivojevic et al., 2016, 2017 (D–F).

