
Table 2.
A summary of results obtained for mitochondria-related genes from DEG, correlation analysis, and gene enrichment of two public datasets.
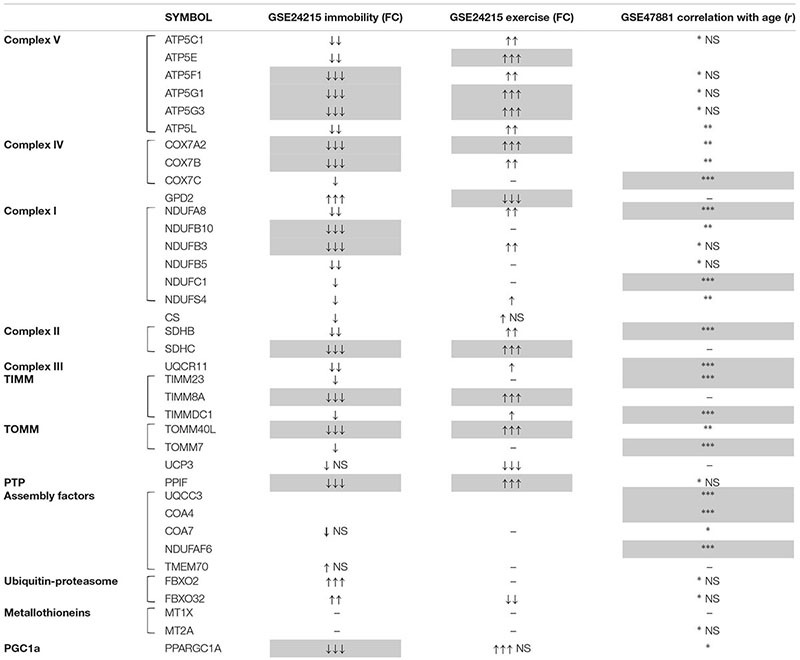 |
(↑↑↑) FC > 1.5; (↑↑) 1.30 < FC < 1.49; (↑) 1.20 < FC < 1.29; (–) FC < 1.19.
(↓↓↓) FC < -1.5; (↓↓) -1.49 < FC < -1.30; (↓) -1.29 < FC < -1.20; (-) FC > -1.19.
(∗∗∗) negative strong correlation; (∗∗) negative moderately strong correlation; (∗) negative weak correlation; (-) r < -0.2 (no correlation). Empty cells: values not present in the array. The gray cells indicate data referred to results of the gene enrichment analyses (Tables 1, 3).