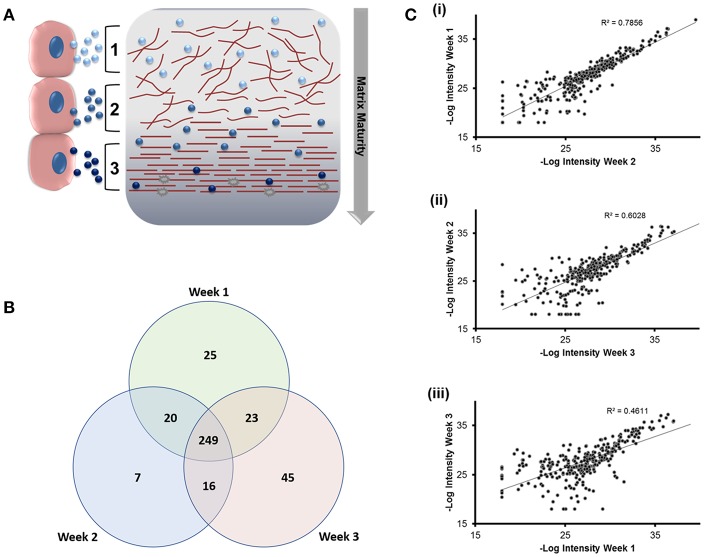
Figure 3.
Analysis of differentially expressed proteins localized to osteoblast sEVs identified using LC-MS/MS. sEVs were isolated from three separate donors with three repeats performed for each donor. (A) Schematic representation of the relationship between sEVs in relation to the maturity and organization of the mineralized matrix. (B) Venn diagram depicting specific and non-specific proteins localized to sEVs isolated during 1, 2- and 3-weeks mineralization. (C) MS peak intensity plots comparing -Log10 MS-peak intensities of proteins associated with sEVs during weeks 1 (i), 2 (ii), and 3 (iii) of differentiation and their associated Pearson's correlation values. N = 3.

