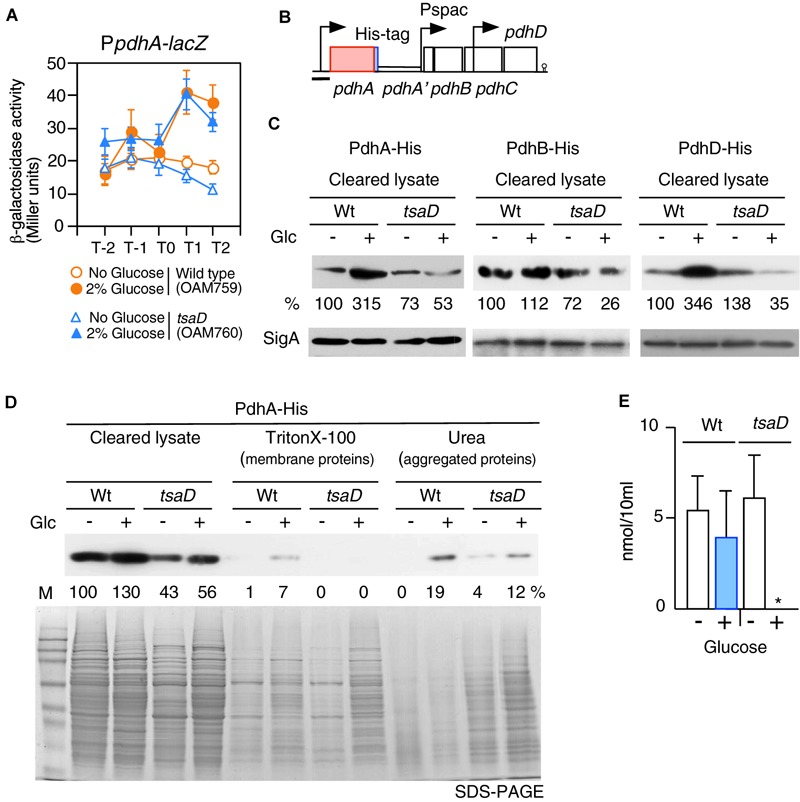
FIGURE 6.

Expression of PpdhA-lacZ and measurement of soluble PDH subunits in the tsaD mutant. (A) Expression of PpdhA-lacZ. Means of the β-Gal activities from three independent experiments and the standard deviations are shown. The x axis is the same as in the legend to Figure 1. (B). The chromosomal structure of the strain with pdhA-His (OAM761) is shown. The legend for graphics is the same as that of Figure 3. The black bar shows the cloned promoter region for analyzing promoter expression. The chromosomal structures of the strains bearing PdhB-His and PdhD-His are similar to that of OAM761 (not shown). (C) Western analysis of PdhA-His, PdhB-His and PdhD-His. For the culture of each strain bearing His-tagged Pdh subunit [PdhA-His, wild type (OAM761), tsaD (OAM762); PdhB-His, wild type (OAM777), tsaD (OAM778)], 1 mM IPTG was added in sporulation medium with or without 2% glucose (“Glc” means glucose addition). For the cultures of strains with PdhD-His, wild type (OAM779) and tsaD (OAM780), no IPTG was added. Equal protein amounts of soluble fractions were analyzed in western blot using anti-His-tag monoclonal antibody for detection of each His-tagged protein. As a control, SigA detected by anti-SigA antibody is shown. (D) Western blot analysis of cleared cell lysates, “membrane protein” fractions (Triton X-100 extracts), and “aggregated protein” fractions (insoluble fractions by Triton × -100, solubilized by urea-containing buffer) from the wild type and tsaD cells for PdhA-His. OAM761 and OAM762 cells were cultivated and treated as described in the Materials and Methods. Cell mass equivalents were analyzed using both western blot and SDS-PAGE stained by Coomassie. “M” indicates molecular weights marker (Amersham full range rainbow marker). (E) Examination of cellular acetyl-CoA pool. Samples from two independent cultures (wild type, 168; tsaD, OAM734) were analyzed three times, and standard deviations are shown. ∗indicates that the value is less than the detection limit (0.5 nmol/10 ml).
