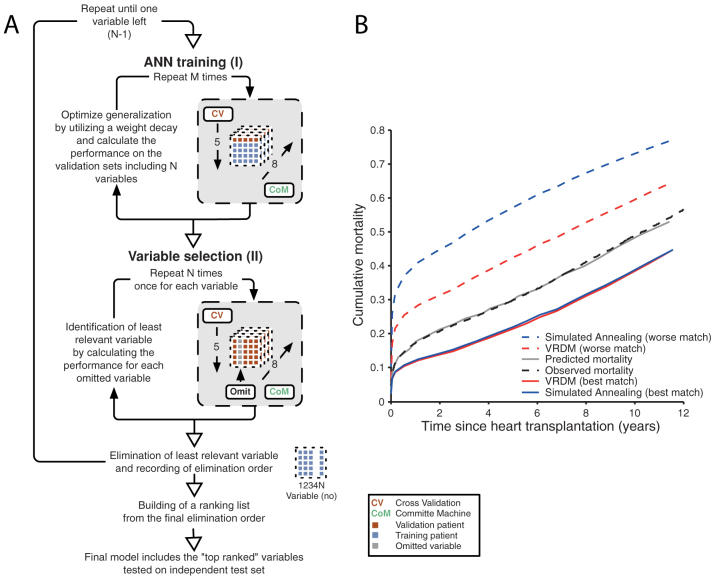
Figure 1. Schematic illustration of the variable-ranking process for ANN training and validation.
Panel (A): Step I: training of the survival model using fivefold cross-validation and a committee machine with 8 members. Step II: variable ranking using the trained survival model from step I. Each variable is omitted from the model and the decrease in performance is recorded. The variable resulting in the least reduction in performance is removed. Steps I–II are repeated until only one variable is left. A ranking list is constructed using the elimination order. To evaluate whether the final ANN risk prediction model was applicable in a patient cohort that had not been used in the development of the ANNs, the validation set (N = 9,842) was used as a blind test. Panel (B): Heart transplantation prediction of conditional failure probability. The solid grey line presents the predicted mortality in the validation cohort using the ANN survival model. The dashed black line presents the observed mortality for the validation cohort (Kaplan-Meier estimate). The predicted mortality obtained with our pilot Simulated Annealing (SA) model is presented with a blue line, Virtual Recipient Donor Match (VRDM) model with a red line. Best match is presented with solid line and worse match with dashed line.

