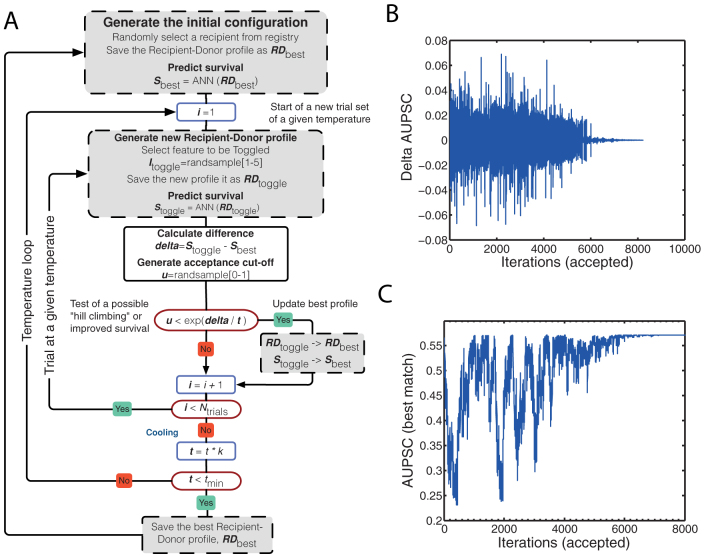
Figure 2. Recipient donor match using simulation annealing (SA).
Panel (A): The simulated annealing (SA) Monte Carlo algorithm: A recipient is randomly selected from the recipient registry. The predicted survival is calculated and the existed recipient-donor profile and the data are recorded. Then the simulation process is started. A donor variable and the value for this variable are selected at random. The difference (delta) between the predicted survival for this new recipient donor profile and the earlier best survival is calculated. If the predicted survival is better than the previous, the best recipient-donor profile and the best-predicted survival are updated. If not the test for allowance “uphill” moves are performed. The allowance for "uphill" moves saves the method from becoming stuck at local minima, which means that a worse value can be accepted in some cases. This procedure is repeated 50 times and then the temperature is decreased with 4%. The whole procedure is started with 50 new trials at this new temperature. When the temperature has gone below 0.000025 the simulation for this patient is ended and a new is selected. The waiting list is updated with a new recipient, and the procedure is repeated. Panel (B): Area under predicted survival curve (AUPSC) related to change in one of the SA variables. Panel (C): Monitoring of the simulated annealing (SA) function as it is looking for a best-case match.

