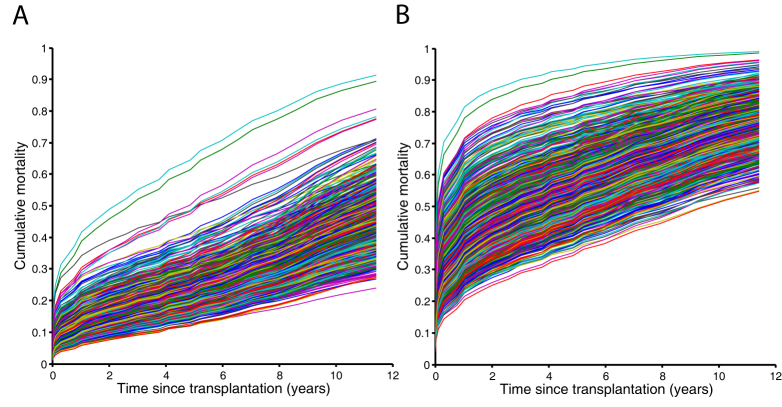
Figure 3. Customize Optimal Donor Using Simulated Annealing (CODUSA).
Panel (A): Random selection of 1,000 patients and their respective survival curve based on the best case customized donor profile. Panel (B): Random selection of 1,000 patients and their respective survival curve based on the worse case customized donor profile.

