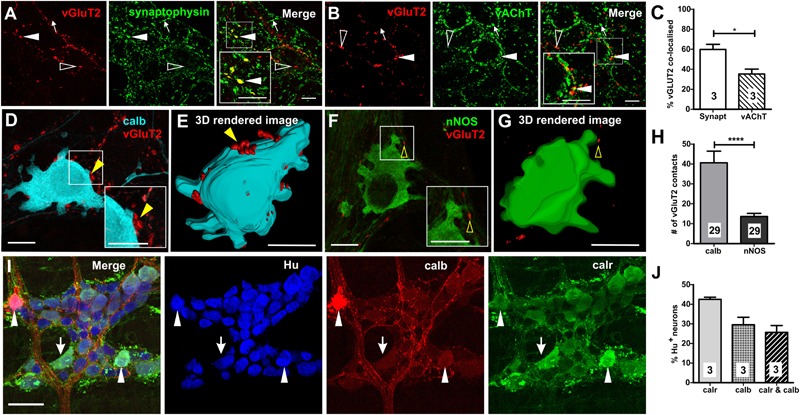
FIGURE 1.

Expression of vGluT2 in the myenteric plexus of mouse distal colon. (A,B) High-resolution micrographs illustrating vGluT2 (red), synaptophysin (green), and vAChT (green) immunoreactive varicosities within the myenteric plexus of mouse colon. Scale bars = 10 μm. (A) Several vGluT2 immunoreactive varicosities contain synaptophysin (filled arrowhead) but some lack synaptophysin (open arrowhead). Some synaptophysin varicosities lack vGluT2 (arrow). (B) Some vGluT2 varicosities contain vAChT (filled arrowhead), but most vGluT2 varicosities lack vAChT (open arrowhead). Likewise, many vAChT varicosities do not express vGluT2 (arrow). (C) Histogram showing the percentage of vGluT2 varicosities co-localized with synaptophysin and with vAChT. A significantly higher percentage of vGluT2 varicosities contain synaptophysin compared to those containing vAChT. Numbers on the bar graphs indicate numbers of animals examined. Fluorescence images (D,F) and 3D rendered surfaces (E,G) of vGluT2 varicosities (red) with a calb+ neuron (D,E) (pseudo colored cyan) and a nNOS+ neuron (F,G) (green) shows vGluT2 varicosities contacting the calb+ (yellow filled arrowheads) but not the nNOS+ neuron (yellow open arrowheads). All scale bars = 10 μm. (H) Histogram illustrating the number of vGluT2 varicosities contacting calb neurons and nNOS neurons. Calb neurons receive significantly more vGluT2 immunoreactive varicosities compared to nNOS neurons. Numbers on the bar graphs indicate numbers of neurons examined. (I) Flurorescence micrograph of the myenteric plexus from the distal colon of a C57Bl/6 mice stained for calb (red), calr (green), and pan-neuronal marker Hu (blue). Some calb neurons lack calr (open arrowheads), some calr neurons lack calb (arrows) and some Hu+ neurons contain both calb and calr (filled arrowheads). Scale bar = 50 μm. (J) Histogram showing the proportions of calr and/or calb+, Hu+ neurons in the myenteric plexus. Numbers on the bar graphs indicate number of animals examined. ∗p < 0.05, ∗∗∗∗p-value < 0.0001; unpaired t-test.
