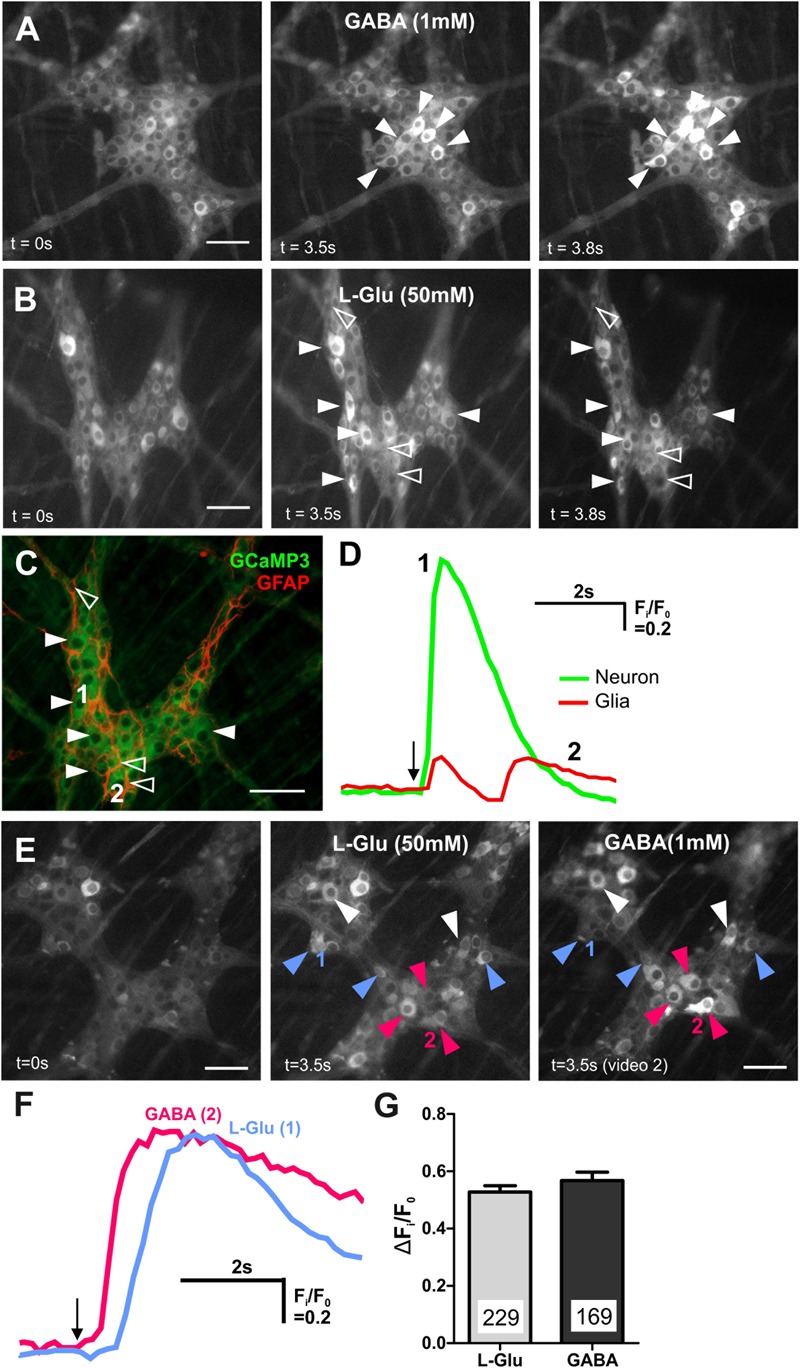
FIGURE 2.

GABA and L-Glu evokes [Ca2+]i transients predominantly in different enteric neurons. (A) Representative fluorescence micrographs of GABA (1 mM) evoked [Ca2+]i transients in myenteric neurons (filled arrowheads) [GCaMP3 signal at rest (t = 0 s) and during GABA spritz in neurons (t = 3.5 s)]. GABA did not evoke [Ca2+]i transients in glia (t = 3.8 s) (B) fluorescence micrograph of L-Glu evoked [Ca2+]i transients in myenteric neurons (filled arrowheads) and glia (open arrowheads) [GCaMP3 signal at rest (t = 0s) and during L-Glu stimuation in neurons (t = 3.5 s) and in glia (t = 3.8 s)]. (C) Confocal micrograph of the imaged myenteric ganglion (in B) showing GCaMP3+ neurons (filled arrowheads) and GCaMP3+/GFAP+ glia (open arrowheads) that responded to L-Glu spritz. (D) Example traces from a neuron (1; green) and a glial cell (2; red) that responded to L-Glu (marked in C). The amplitude of [Ca2+]i transients were larger in enteric neurons compared to glia. Arrow indicates L-Glu application. (E) Representative fluorescence micrographs of L-Glu (50 mM) and GABA (1 mM) evoked [Ca2+]i transients in myenteric neurons [GCaMP3 signal at rest (t = 0 s) and during L-Glu (t = 3.5 s) stimuation and GABA (t = 3.5 s) stimulation, respectively]. Most neurons either responded to L-Glu (blue arrowheads) or GABA (pink arrowheads). Few neurons responded to both L-Glu and GABA (white arrowheads). (F) [Ca2+]i transient traces obtained from neuron 1 and neuron 2 (marked in E). Arrow indicates drug application. (G) Histogram showing the average amplitude of [Ca2+]i transients in response to L-Glu and GABA stimulation. All scale bars = 50 μm. Numbers on the bar graphs indicate numbers of neurons examined.
