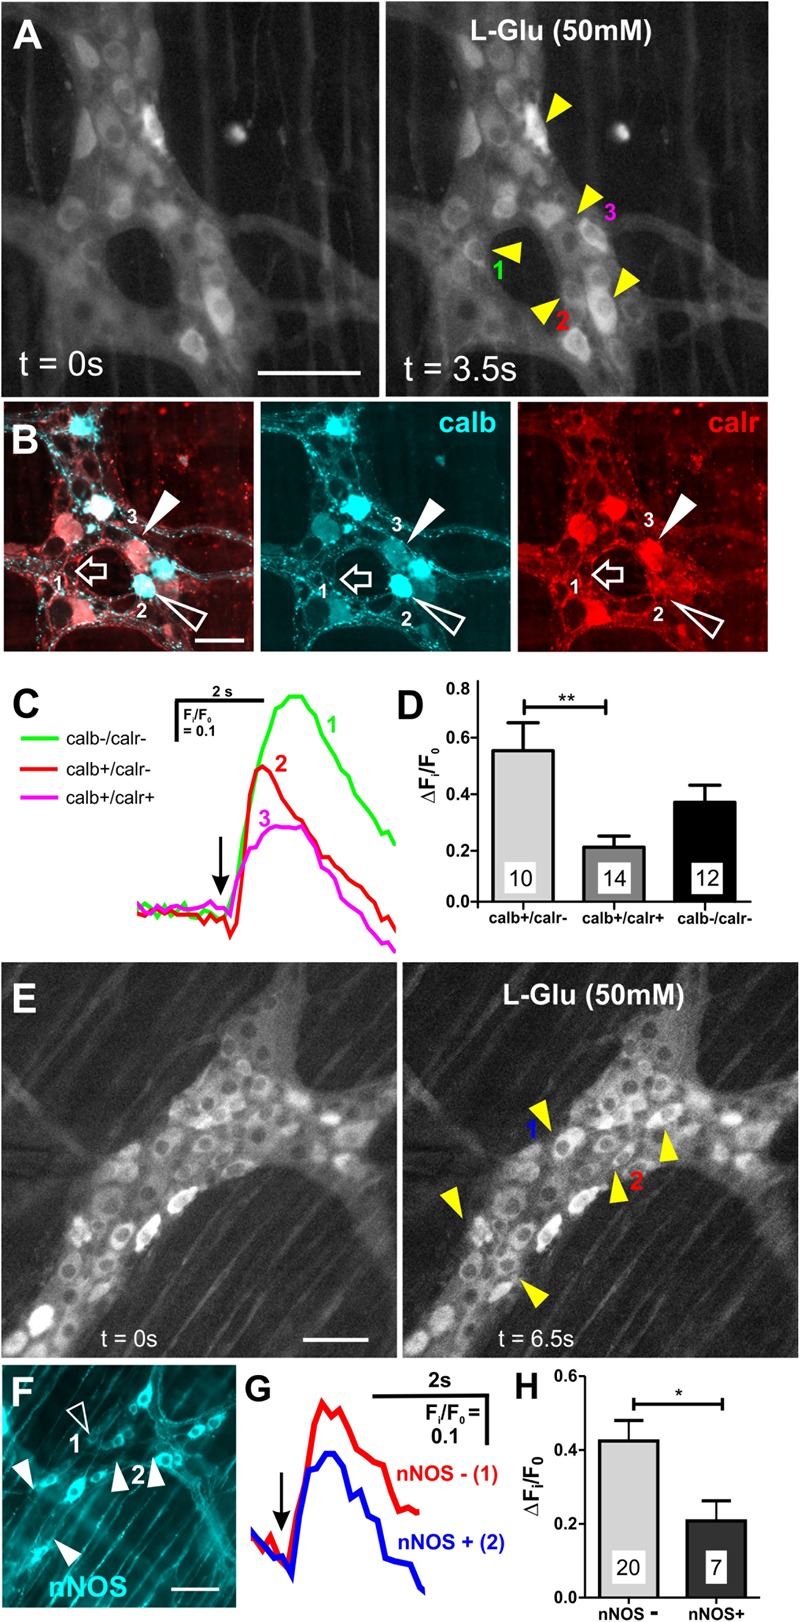
FIGURE 3.

Neurons that expressed calb or lacked nNOS had larger L-Glu-evoked [Ca2+]i transients. (A) Representative fluroescence micrographs of L-Glu (50 mM) evoked [Ca2+]i transients in myenteric neurons [GCaMP3 signal at rest (t = 0 s) and during L-Glu stimuation (t = 3.5 s)]. (B) Confocal micrograph of the imaged myenteric ganglion (in A) shows some L-Glu responsive neurons that did not express calb or calr (open arrow, neuron 1), was only immunoreactive for calb (open arrowhead, neuron 2) or was immunoreactive for calb and calr (filled arrowhead, neuron 3). (C) Example traces from the 3 neurons (marked in A,B) that responded to L-Glu, demonstrating that the neuron that contained calb only exhibited larger L-Glu-evoked [Ca2+]i transient. Arrow indicates the when L-Glu was spritzed. (D) Histogram showing the average amplitude of L-Glu-evoked [Ca2+]i transients. Neurons only positive for calb had larger amplitudes compared to those that contained both calb and calr. (E) Representative fluroescence micrographs of L-Glu (50 mM) evoked [Ca2+]i transients in myenteric neurons [GCaMP3 signal at rest (t = 0 s) and during L-Glu stimuation (t = 3.5 s)]. (F) Confocal micrograph of the imaged myenteric ganglion (in A) shows some L-Glu responsive neurons were nNOS+ (psuedo colored cyan; open arrowheads). Most L-Glu responding neurons lacked nNOS (filled arrowheads). (G) Example traces from 2 neurons (marked in E,F) that responded to L-Glu, demonstrating that the nNOS – neuron (2) exhibited larger L-Glu-evoked [Ca2+]i transient compared to the nNOS+ neuron (1). Arrow indicates when L-Glu was spritzed. (H) Histogram showing the average amplitude of L-Glu-evoked [Ca2+]i transients. nNOS– neurons had larger amplitudes compared to nNOS+ neurons. All scale bars 50μm. Number of neurons examined are indicated on the bar graphs; ∗p < 0.01, ∗∗p = 0.003; unpaired t-test.
