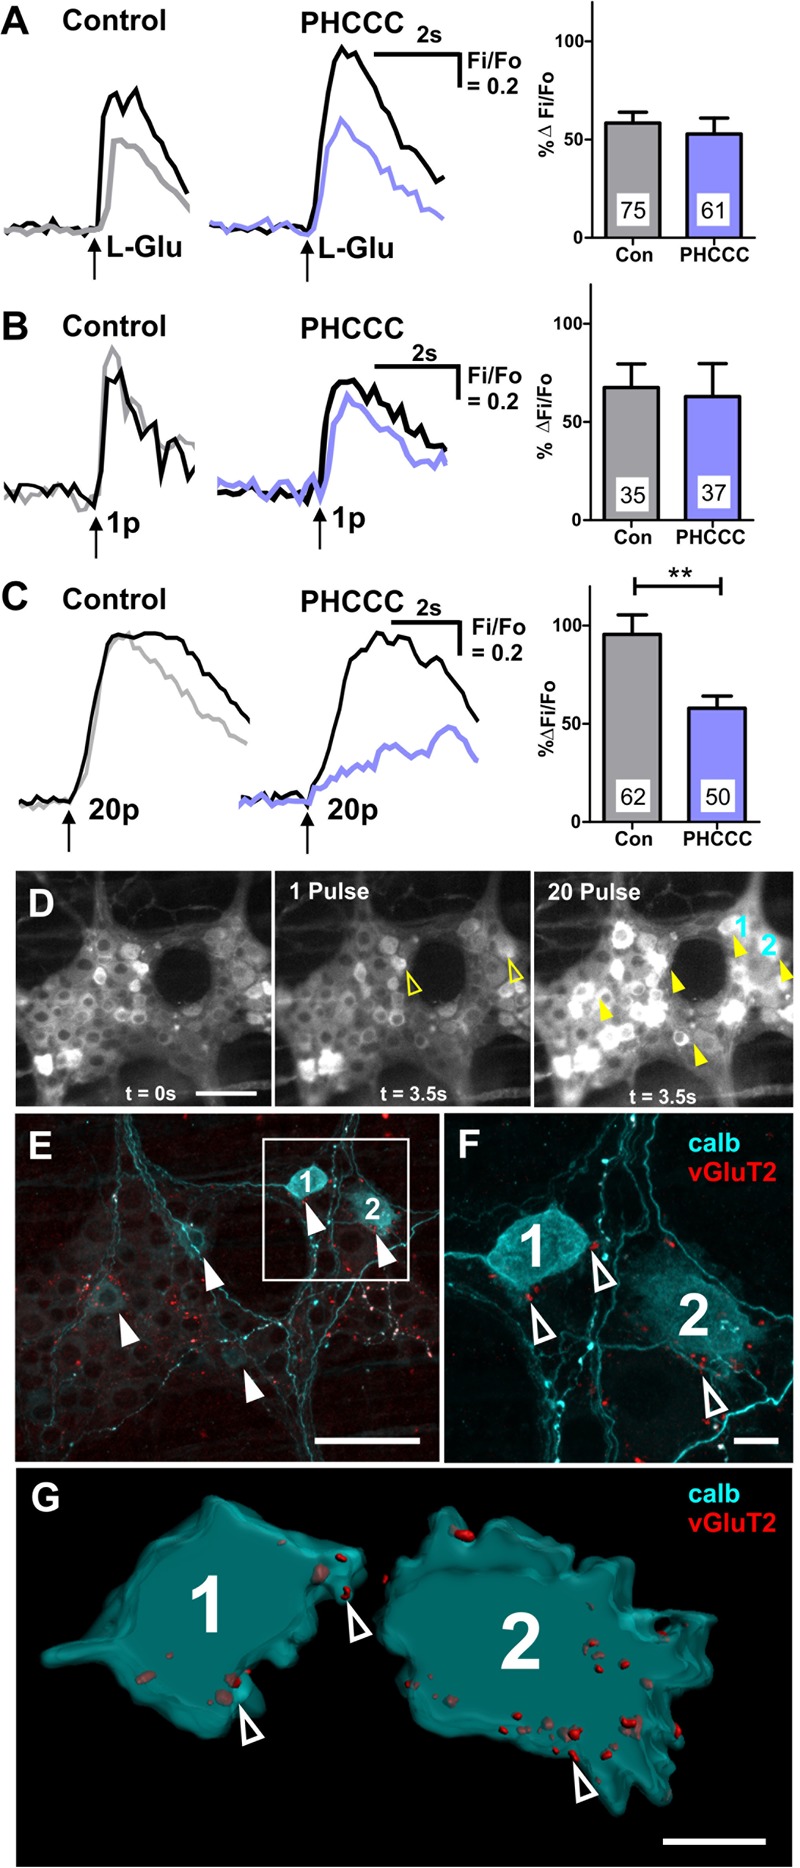
FIGURE 5.

Calbindin+ myenteric neurons receive vGluT2+ varicosities, and exhibit 20 pulse-evoked [Ca2+]i transients that are mediated by Group I mGluRs. Representative traces of [Ca2+]i transients evoked by L-Glu (50 mM) spritz (A), 1 pulse (B), and 20 pulse (C) electrical stimulation during time controls (1st stimulation: black trace; 2nd stimulation: gray trace) and PHCCC treatment (control: black trace; PHCCC: purple). Histograms showing pooled [Ca2+]i transient amplitudes from all neurons stimulated with L-Glu (A), 1 pulse (B), and 20 pulse (C) in time control (con) and in the presence of PHCCC. Changes in amplitude after application PHCCC are presented as a percentage of the first response in control saline (% ΔFi/F0). Numbers on bar graphs indicate the number of neurons examined. PHCCC significantly reduced the amplitude of 20 pulse-evoked [Ca2+]i transients in L-Glu responding neurons (∗∗p < 0.01; unpaired t-test). (D) Representative fluroescence micrographs of 1 pulse and 20 pulse electrical stimulation-evoked [Ca2+]i transients in myenteric neurons [GCaMP3 signal at rest (t = 0 s) and during 1 pulse and 20 pulse electrical stimulation stimuation (t = 3.5 s), respectively]. (E) Confocal micrograph of the imaged myenteric ganglion (in D) stained for calb. Some neurons calb+ neurons responded to 1 pulse (yellow open arrows in D), most calb+ neurons identified responded to 20 pulse stimulations (yellow filled arrows in D). Scale bars 50 μm. Enlarged confocal micrograph (F) and 3D rendered surfaces (G) of a section in (E), illustrate close contacts of vGluT2 varicosities (open arrowheads) onto two calb+ neurons (marked 1 and 2) that responded to 20 pulse stimulation. Scale bar 10 μm.
