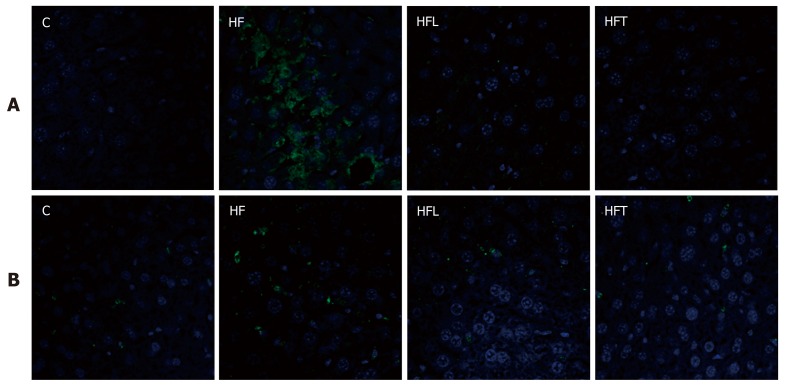
Figure 2.
Angiotensin type-1 receptor (A) and PLIN 2 (B) assessed by immunofluorescence (green) in the liver. Scale bars correspond to 50 µm, same magnification for all immunoreactions (40 x). C: Control group; HF: High-fat diet; HFL: HF diet treated with losartan; HFT: HF diet treated with telmisartan.

