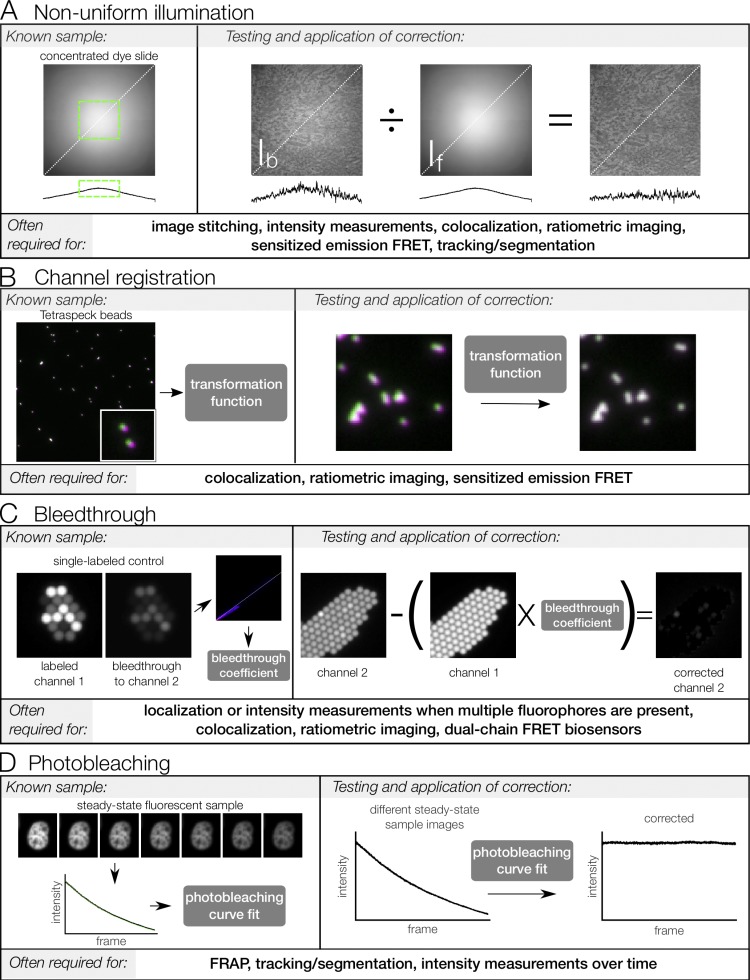
Figure 2.
Measurement and computational correction of image errors. Known samples are used to measure systematic errors in microscopy images. From the measurement, a correction can be generated, tested, and applied to experimental images. Correction procedures are summarized here and some steps (e.g., background subtraction) have been omitted. Please refer to the main text for references that cover these corrections in more detail. (A) Illumination nonuniformity. Concentrated dye is mounted between a coverslip and a slide and sealed. This dye, if sufficiently concentrated, acts as a thin, uniformly fluorescent sample (see Model and Burkhardt, 2001; Model, 2006). This “flat-field image” can be used to determine a region with minimal illumination variation (green box) or can be used to correct experimental images. The correction is tested by applying to a biological sample of roughly uniform intensity across the field of view, here a kidney section labeled with AlexaFluor568 phalloidin. Line scans below each image show intensity along the indicated white dotted line. (B) Channel registration. Tetraspeck beads are infused with four fluorescent dyes, including the green and red dyes imaged here (pseudo-colored green and magenta, respectively). Because the images of the beads in each channel should overlay perfectly, they can be used to generate a transformation matrix that describes the transformation needed to align the images. This matrix is then tested by using it to correct a different image of Tetraspeck beads. Once tested, the matrix can be used to register channels of experimental images. (C) Bleed-through. Samples labeled with a single fluorophore are used to measure bleed-through by imaging all channels with the same settings used for acquisition in the experiment. Here, 2.5-µm beads labeled with a dye corresponding to channel 1 are used. The intensity of bleed-through into channel 2 is plotted as a function of intensity of channel 1, and a linear regression of this plot is used to generate a bleed-through coefficient. This coefficient is then tested by applying to a different single-labeled control image and verifying that bleed-through into channel 2 is reduced. Once tested, the bleed-through coefficient can be used to correct for bleed-through in experimental images (provided channels are properly registered, as described above). (D) Photobleaching. Samples with steady-state fluorescence are used to generate a photobleaching curve under the planned experimental conditions. This curve is fit to an exponential function, which is then tested by correcting a different set of images of the steady-state sample. Once tested, the correction can be applied to experimental images under similar conditions; that is, if the correction is to be used across multiple days or sessions, it should be validated on images collected on multiple days. FRET, Förster resonance energy transfer.

