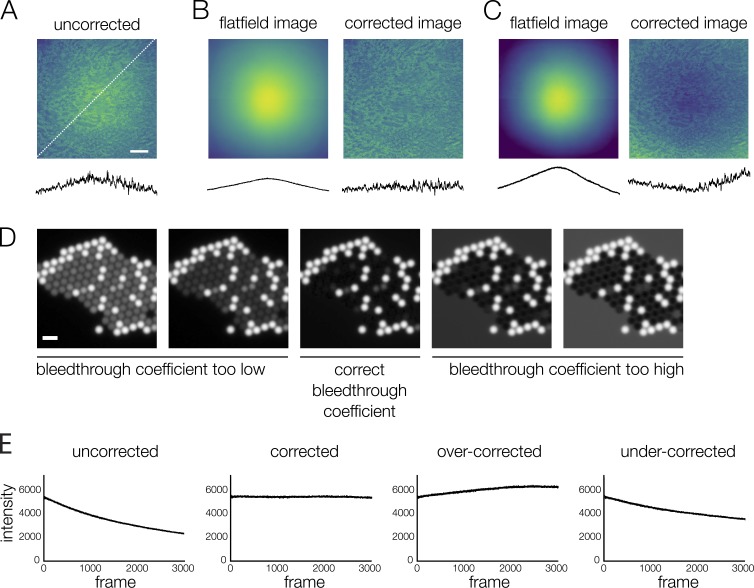
Figure 4.
Image corrections must be tested carefully. (A–C) Flatfield correction. (B) When the flatfield image truly represents the illumination distribution, the uniformity of the test image (kidney section labeled with AlexaFluor568 WGA) is improved (see line scans below images, measured at the location indicated by the dotted white line in A). (C) When the correction is performed with a flatfield image that does not represent the illumination distribution, or has been normalized incorrectly, the test image is less uniform after correction. Correcting with an inaccurate flatfield image can add error to quantitative intensity measurements. If the flatfield image does not perform well in tests, a better solution is to define a subregion with less variable intensity (see Fig. 2 A). (D) Bleed-through correction. If the estimated bleed-through coefficient is inaccurate, bleed-through correction can lead to artifacts in the image that will add error to quantitative intensity measurements. Because these images contain no overlap between channels (mixed beads as in previous bleed-through figures, channel 2 shown), incorrect bleed-through coefficients show obvious artifacts; artifacts will be less obvious in experimental images with some overlap in signal. The bleed-through coefficient should be tested on single-labeled sample images before applying to experimental images. (E) Photobleaching correction. The sample in this example is fixed, meaning variation in intensity is due only to photobleaching and detector noise. If the rate of photobleaching is correctly measured, the corrected intensity values remain constant over time. If the rate of photobleaching is over- or underestimated, the corrected intensity values are no longer constant. Inaccurate corrections are obvious when applied to a steady-state sample, but over- or undercorrection may be impossible to detect when applied to a signal that varies over time. Scale bars: (A) 100 μm, (D) 5 μm.

