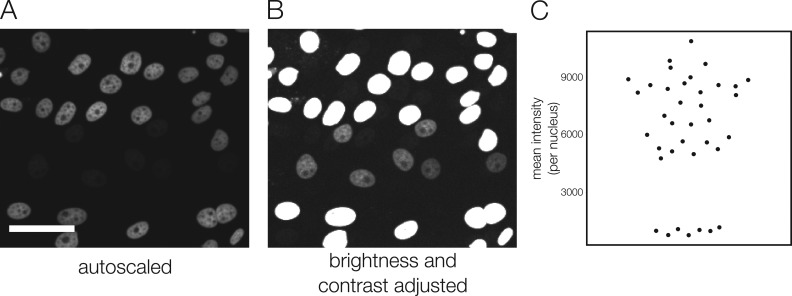
Figure 6.
Visual inspection of images is prone to confirmation bias. (A and B) In this example, cells labeled with a fluorescent nuclear marker exist in two populations, one with very bright nuclear labeling and the other with much dimmer labeling. If the image is autoscaled (A), the dimmer population is invisible, but brightness and contrast adjustments show that there is also a population of cells with lower intensity labeling (B). Making conclusions based on images displayed using autoscale (the most common default display in image acquisition programs), rather than measuring image intensity values, could lead to inaccurate conclusions. A researcher who is convinced by the image display because it represents the expected result, and therefore makes the decision not to complete a full quantitative analysis, is subject to confirmation bias. Scale bar: 50 μm. (C) Measured intensity of the nuclei in the images. Each dot represents the mean intensity of one nucleus.

