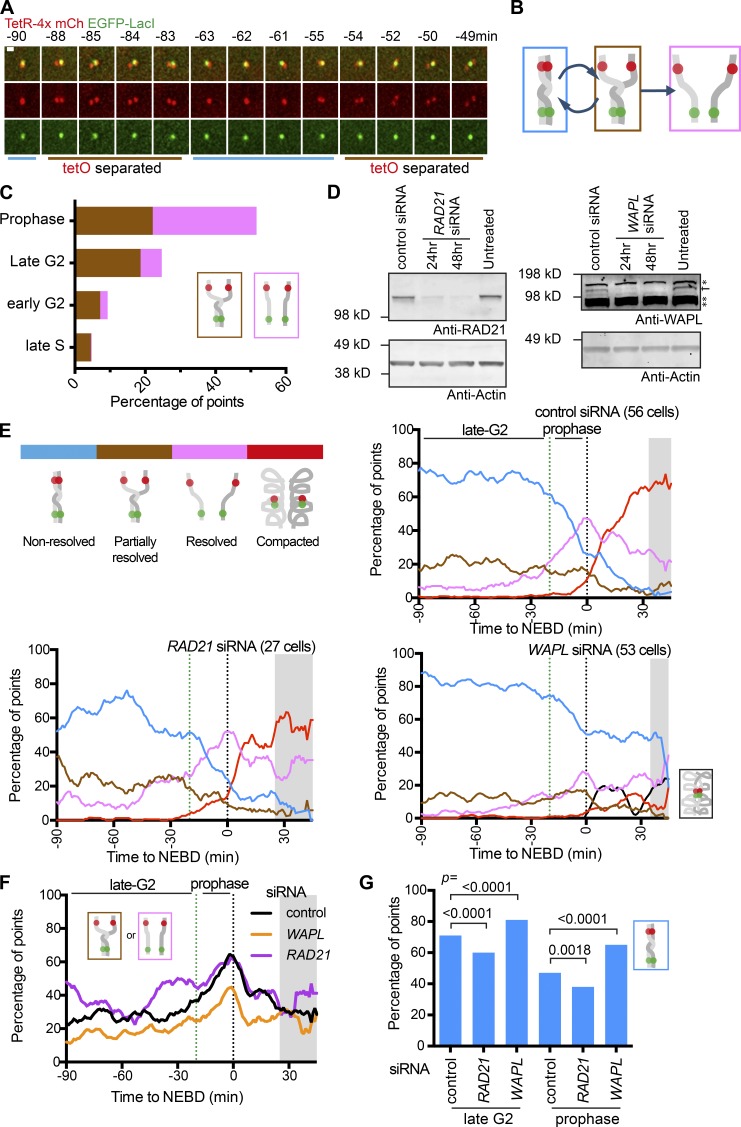
Figure 3.
Sister chromatids cycle between nonresolved and partially resolved states during late G2 phase, antagonistically regulated by cohesins and WAPL. (A) Time-sequence images of the fluorescence reporter showing cyclical separation of sister tetO. Times are relative to NEBD. Scale bar, 1 µm. (B) Diagram depicting cyclical partial sister resolution (brown state) in late G2 phase, leading to full resolution (pink state) in prophase. (C) The proportion of the brown “partially resolved” or the pink “resolved” state during the indicated cell cycle phases. The cell cycle phases were determined in TT104 cells carrying Cerulean-PCNA (n = 61 cells in late S and early G2 phase and 26 cells in late G2 and prophase). (D) Western blots for RAD21 (left) or WAPL (right) proteins from cells after siRNA treatment for the indicated time. The control siRNA treatment was over 48 h. Actin is shown as a loading control. Asterisks indicate nonspecific binding of the anti-WAPL antibody. (E) The proportion of each configuration in cells treated with control, RAD21, and WAPL siRNA. Color codes are as in diagram (top, left). TT75 cells were arrested by a double-thymidine block and released and also treated with siRNA, as in Fig. S2 I. WAPL siRNA led to colocalization of all four fluorescent dots (black line) after NEBD in some cells. Data from individual cells are shown in Fig. S2 K. The number of analyzed cells at each point was between 10 and 53 (mean: 33) for control; 10 and 27 (mean: 19) for RAD21; 10 and 52 (mean: 36) for WAPL siRNA, except for the gray-shaded areas where <10 cells were analyzed. (F) The proportion of the brown “partially resolved” plus pink “resolved” state after control, RAD21 and WAPL siRNA treatment. The data were taken from E. The gray shaded area indicates time points that include <10 cells for at least one siRNA treatment. (G) Graph shows the proportion of the blue “nonresolved” state for control, RAD21, and WAPL siRNA during late G2 phase or prophase. These data were taken from E. P values were obtained using a chi-square test. n = 520–3,081 time points.

