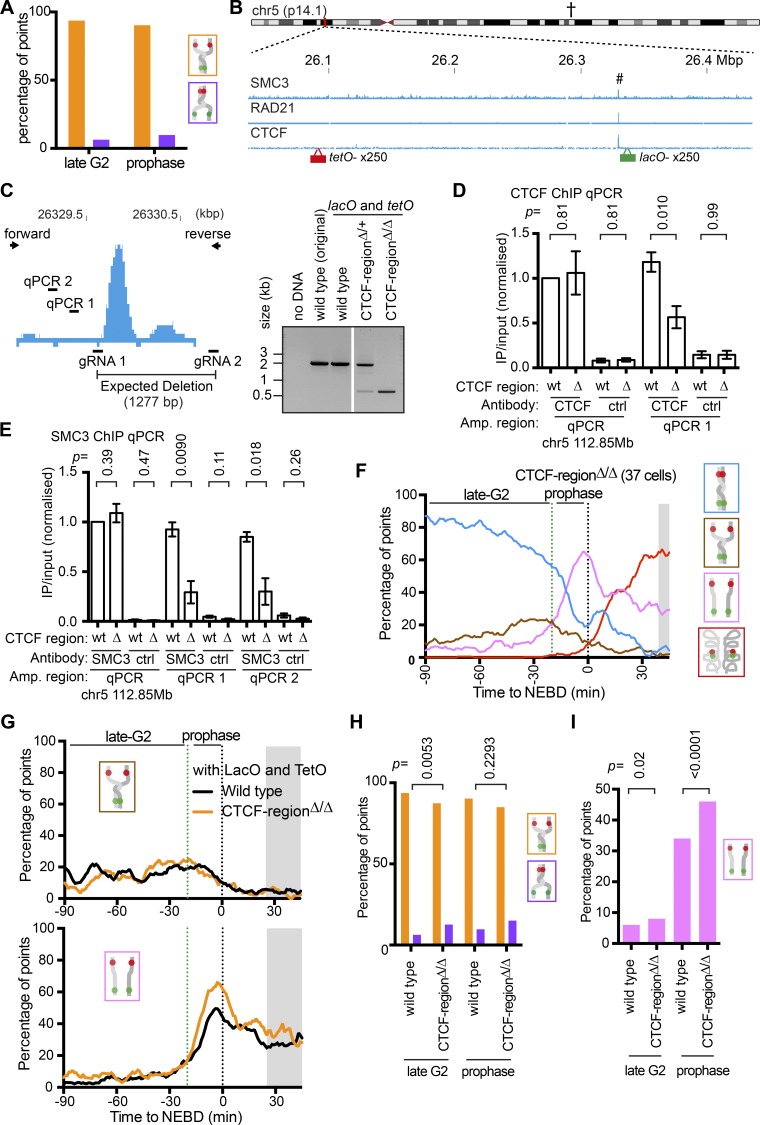
Figure 4.
Local reduction of cohesins at their enrichment site leads to precocious sister chromatid resolution in that region during prophase. (A) Graph shows the proportion of tetO (orange) and lacO (purple) sister separation among all “partially resolved” states in WT cells (TT75) during late G2 phase or prophase. n = 175–381 time points. (B) The ChIP-seq data show the distribution of SMC3, RAD21, and CTCF along the genomic region around integration sites of lacO and tetO. The ChIP-seq data are taken from published data (ENCODE Project Consortium, 2012). (C) The map (left) is a zoomed view of the CTCF ChIP-seq peak at the chromosome region highlighted with # in B. The map also shows the positions on the genome to which guide RNA (gRNA; for CRISPR-Cas9) and PCR primers (forward and reverse, to confirm deletion) correspond, as well as the genome intervals (qPCR1 and qPCR2) for ChIP-qPCR in D and E. PCR (right) gave a band of the expected size, ∼2 kb from intact genome DNA and ∼0.7 kb from genomic DNA containing the deletion. (D and E) Graphs show results of ChIP-qPCR. An antibody against CTCF or SMC3, or a nonspecific antibody (mouse or rabbit IgG), was used for ChIP with WT (wt) or CTCF-regionΔ/Δ (Δ) cells (TT75 and TT108, respectively). The genome intervals (qPCR1 and qPCR2 in C) were amplified by PCR following ChIP. A region on chromosome 5 (112.85 Mbp), where CTCF and cohesins are enriched, was also amplified by PCR as a control (indicated as † in B and zoomed in Fig. S3 D). For each sample, the yield (IP/input DNA) was normalized to that at the control region in WT cells. ChIP-qPCR was repeated four and three times for CTCF and SMC3, respectively (Fig. S3, E and F), and means and standard errors are shown in graphs. P values were obtained by t tests. (F) The proportion of each configuration of the fluorescence reporter for CTCF-regionΔ/Δ cells (TT108) was plotted over time. TT108 cells were synchronized and analyzed as in Fig. 2, C and D. Data from individual cells are shown in Fig. S3 G. The number of analyzed cells at each point was between 10 and 36 (mean: 26), except for the gray-shaded area where <10 cells were analyzed. (G) The proportion of the brown “partially resolved” (top) or pink “resolved” (bottom) state for WT or CTCF-regionΔ/Δ cells. These data were taken from Figs. 2 D and 4 F. The gray-shaded area is as in Fig. 3 F. (H) The graph shows the proportion of tetO (orange bars) and lacO (purple bars) sister separation among all “partial resolution” states in WT and CTCF-regionΔ/Δ cells during late G2 phase or prophase. P values were obtained using the chi-square test. n = 93–381 time points. (I) The proportion of the pink “resolved” state for WT or CTCF-regionΔ/Δ cells during late G2 phase or prophase. These data were taken from Figs. 2 D and 4 F. P values were obtained using the chi-square test. n = 680–2,406 time points. ctrl, control; IP, immunoprecipitated.

