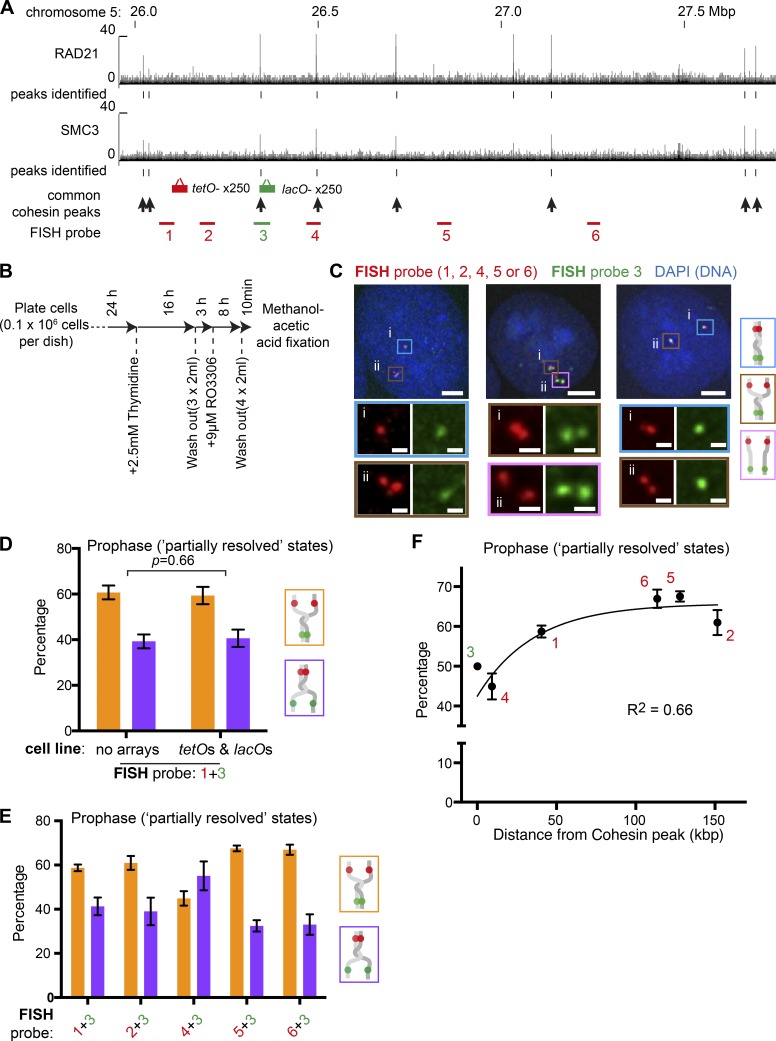
Figure 5.
FISH results suggest correlation between local cohesin enrichment and robust sister chromatid cohesion during prophase. (A) The ChIP-seq data (ENCODE Project Consortium, 2012) show the distribution of RAD21 and SMC3 along the genomic region around insertion sites of lacO and tetO. Common enrichment sites of RAD21 and SMC3 are indicated by black arrows. The regions against which FISH probes were generated are indicated as red or green bars. (B) Experimental procedure outline. Cells were arrested in S phase using thymidine, released, and subsequently arrested at the G2-M phase boundary using the CDK1 inhibitor RO-3306. Prophase cells were fixed 10 min after washout of RO-3306. (C) Fixed prophase cells were hybridized with the indicated FISH probes (their positions are shown in A). Zoomed regions for each cluster of hybridized probes, corresponding to i or ii in the panel above, are shown below with the frames color-coded according to the key on the right. Scale bars, 5 µm (top) and 1 µm (bottom; zoomed images). (D) Graph shows the proportion of sister separation between FISH probes 1 (orange bars) and 3 (purple bars) shown in A among all “partial resolution” states for different prophase cells either containing no operator array (WT HT-1080) or containing tetO and lacO (TT75). Mean and standard error are shown from three independent experiments (n = 150–249 FISH signal clusters were analyzed in each experiment). P values were obtained by chi-square test. (E) Graph shows the proportion of sister separation between indicated pairs of FISH probes (shown in A) among all “partial resolution” states in prophase of WT HT-1080 cells (no tetO or lacO). Mean and standard error are shown from four to seven independent experiments for each FISH probe pair (n = 134–416 FISH signal clusters were analyzed in each experiment). (F) Sister chromatid separation rates for each FISH probe, plotted against distance to the center of the nearest cohesin peak indicated in A. Mean and standard error percentage sister separation was plotted for FISH probes 1, 2, 4, 5, and 6 (as in E). These probes were used with probe 3 in E. To represent separation of probe 3 for comparison with the other probes, we plotted a fixed value of 50%. This is the theoretical rate of separation for any probe when mixed with an identical probe for this experiment. The data points were fit to an exponential one-phase decay curve, and the R2 value shows closeness of the fit.

