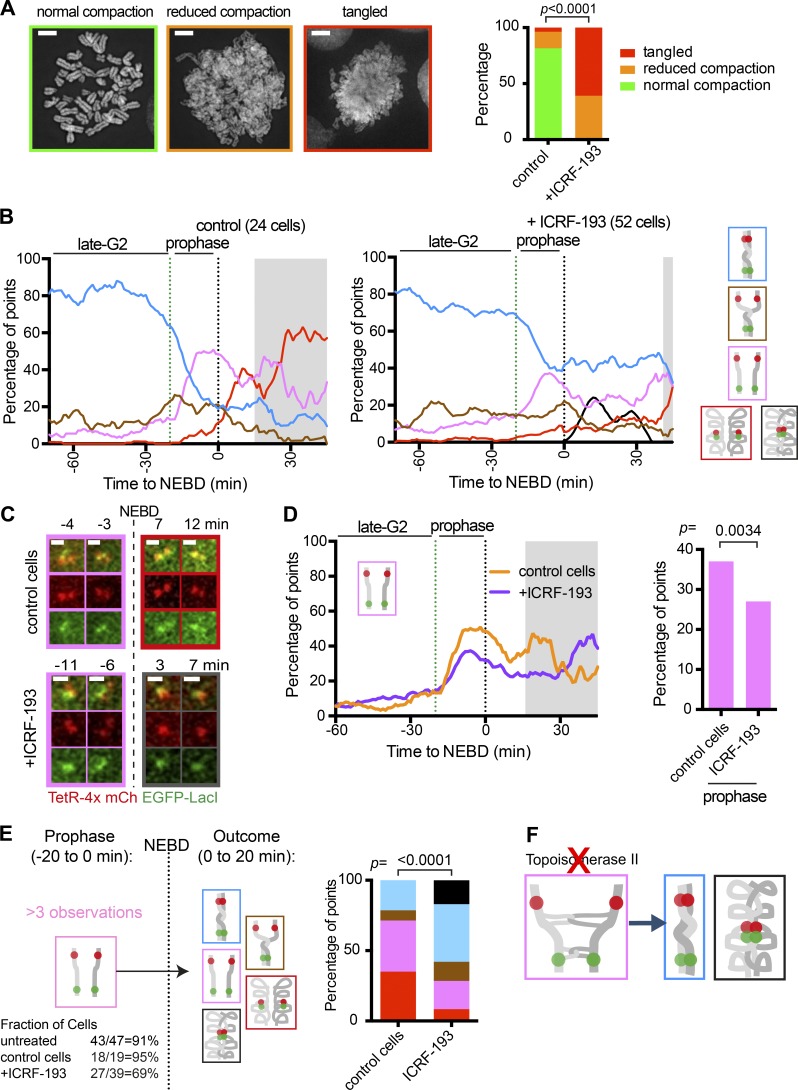
Figure 6.
Topo II is required to stabilize resolved sister chromatids during prometaphase. (A) Spread of metaphase chromosomes from ICRF-193–treated and control cells. Representative metaphase spreads are shown on the left with the frame of the color coding. Scale bars, 5 µm. The proportion of each class of spread is shown on the right (n = 27 for control and 23 for ICRF-193 treatment). The P value was obtained by the chi-square test. (B) The proportion of each configuration of the fluorescence reporter in control and ICRF-193–treated cells. TT75 cells were arrested by a double-thymidine block, released, treated with MK1775 and ICRF-193 (or only with MK1775 for control), and observed by live-cell microscopy, as in Fig. S4 A. Data from individual cells are shown in Fig. S4 B. The number of analyzed cells at each time point was between 10 and 21 (mean: 16) for control; 10 and 46 (mean: 30) for ICRF-193, except for the gray-shaded areas where <10 cells were analyzed. (C) Representative live-cell images of the fluorescence reporter in a control or ICRF-193–treated cell. The frame colors match the color coding in B. (D) The proportion of the pink “resolved” state for control or ICRF-193–treated cells plotted against time (left) or during prophase (right). These data were taken from B. The gray-shaded area is as in Fig. 3 F. P value was obtained by chi-square test (n = 366 and 961 for control and ICRF-193–treated cells, respectively). (E) The change in the fluorescence reporter configuration following NEBD. Diagram (left) shows the pipeline of assessment; cells with the pink “resolved” state for four or more time points during prophase (the fraction of such cells shown at bottom) were assessed further. In such cells, configurations during the 20 min following NEBD were scored in control (n = 142 time points) and ICRF-193–treated (n = 254) cells (right). P value was obtained by chi-square test. (F) Diagram explaining the outcome with the inhibited topo II activity.

