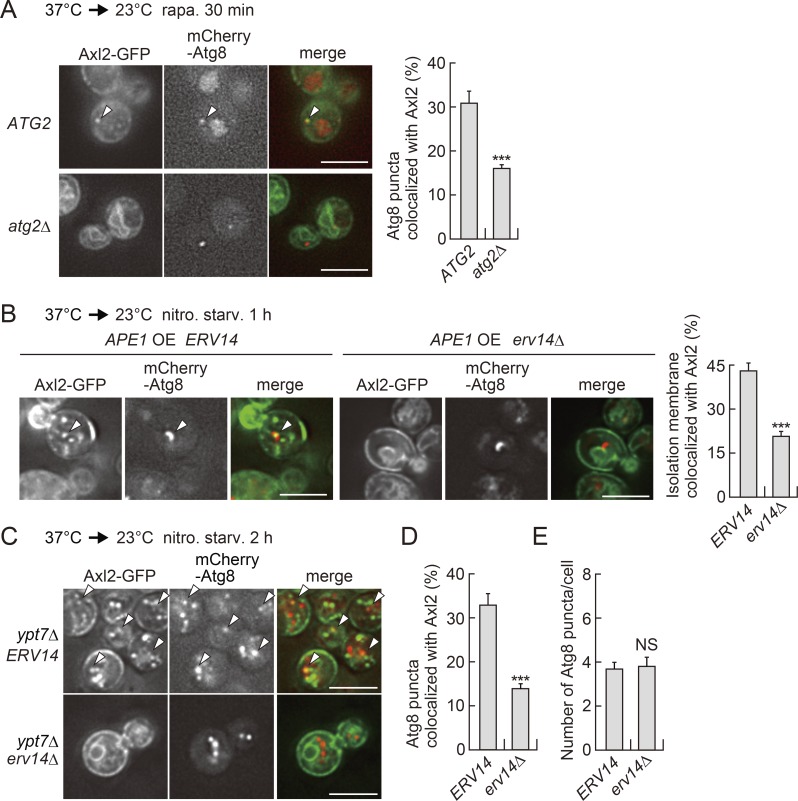
Figure 2.
COPII vesicles are recruited to forming autophagosomes. (A) Axl2 localization to Atg8 puncta in atg2Δ cells was examined as described in Fig. 1 C. Scale bars, 5 µm. Values in the graph are means ± SD (n = 3). ***, P < 0.001 (unpaired two-tailed t test). (B) sec12ts SSA1pro-AXL2-GFP cells overexpressing Ape1 were incubated at 37°C for 1 h, transferred to nitrogen-starvation medium at 23°C for 1 h, and then observed by fluorescence microscopy. Arrowheads show an Axl2-GFP punctum on an isolation membrane visualized with mCherry-Atg8. Scale bars, 5 µm. The graph shows the proportion of Atg8-positive isolation membranes that colocalized with Axl2-GFP. Values are means ± SD (n = 3). ***, P < 0.001 (unpaired two-tailed t test). (C–E) sec12ts SSA1pro-AXL2-GFP ypt7Δ cells were incubated at 37°C for 1 h, transferred to nitrogen-starvation medium at 23°C for 2 h, and then observed by fluorescence microscopy. Arrowheads show Axl2-positive Atg8 puncta. Scale bars, 5 µm. The graphs show the proportion of mCherry-Atg8 puncta that colocalized with Axl2-GFP (D) and the number of Atg8 puncta per cell (E). Values represent means ± SD (n = 3). ***, P < 0.001 (unpaired two-tailed t test).

