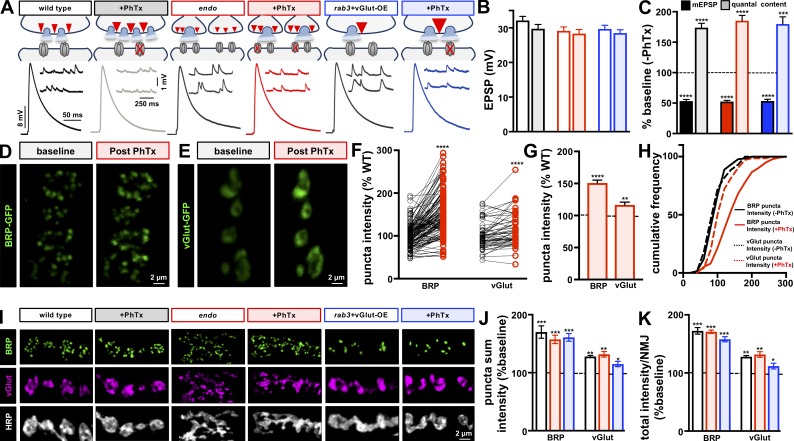
Figure 7.
Homeostatic potentiation can be balanced with both depression and AZ scaling. (A) Schematic and representative traces of recordings from wild type, endo, and rab3 mutants combined with vGlut overexpression (rab3+vGlut-OE: w;OK6-Gal4,rab3rup/rab3rup,UAS-vGlut) before and after PhTx application. Diminished mEPSP amplitudes are observed following PhTx application, while EPSP amplitudes are maintained at baseline levels due to a homeostatic increase in presynaptic neurotransmitter release (quantal content). (B and C) Quantification of EPSP amplitude (B) and mEPSP and quantal content values (C) after PhTx application normalized as a percentage of baseline values (no PhTx treatment) in the indicated genotypes (n ≥ 6; t test; Table S1). (D and E) Representative live images of muscle 6 NMJ boutons expressing endogenously tagged BRP-GFP (w;BRP-GFP; D) and vGlut-GFP (w;vGlut-GFP; E) at baseline and following 10-min incubation in PhTx. (F–H) Quantification of BRP and vGlut sum intensity of the same puncta before and following PhTx application (F), with an increased average (G) and rightward distribution (H) observed. n ≥ 135, BRP; n ≥ 72, vGlut; ratio paired t test (F), Student’s t test (G), K-S test (H); Table S1. (I) Representative images of boutons immunostained with anti-BRP, anti-vGlut, and anti-HRP in the indicated genotypes before and following PhTx application. A parallel increase in BRP and vGlut intensity is observed in all genotypes following PhTx application. (J) Quantification of sum fluorescence intensity of BRP and vGlut puncta reveals a significant increase in each genotype following PhTx application compared with baseline (no PhTx). (K) Quantification of total fluorescence intensity of BRP and vGlut puncta per NMJ, showing an enhanced total abundance following PhTx application. Error bars indicate ± SEM (n ≥ 6; t test; Table S1). *, P < 0.05; **, P < 0.01; ***, P < 0.001; ****, P < 0.0001; ns, not significant.

