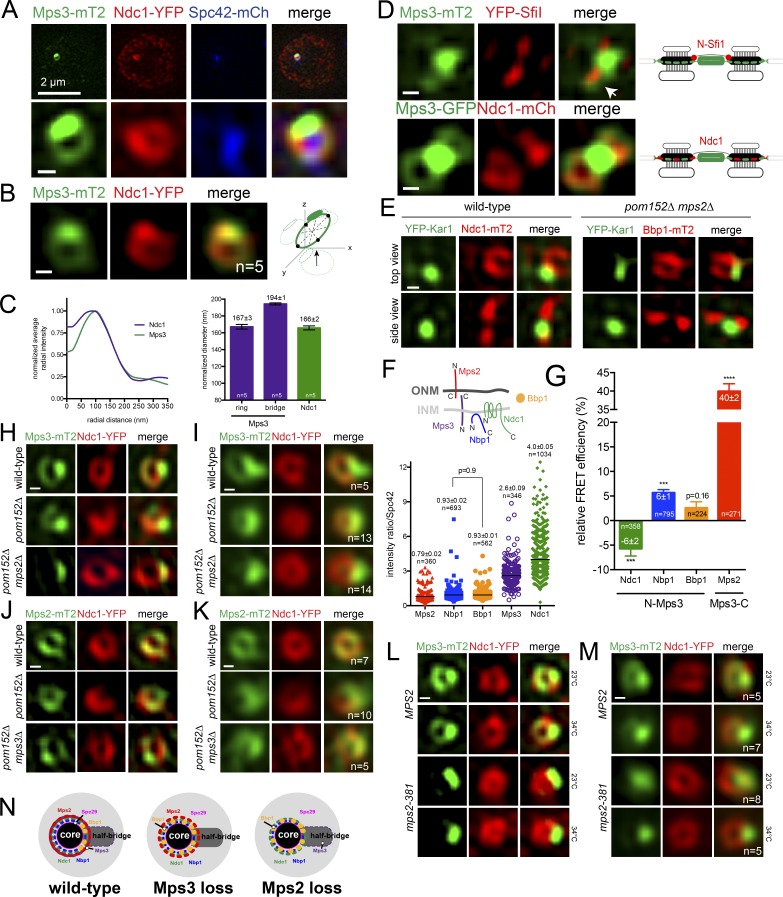
Figure 2.
Mps3 localization to the SPB toroid is Mps2 dependent. (A and B) Representative SIM image of nucleus from a cell containing Ndc1-YFP (red), Spc42-mCherry (blue), and Mps3-mT2 (green; SLJ10636). Bar, 2 µm. The SPB region (A) and averaged ring from the indicated number (n) of images (B) are below. (C) Ring diameter, as in Fig. 1 E. Because Mps3-mT2 was anisotropic, its diameter varied based on the region selected for analysis; shown are the ring region only and ring and the half-bridge domain. Errors were determined by Monte Carlo analysis. (D) In G1 cells (SLJ12060), Mps3-mT2 (green) is present between the YFP-Sfi1 (red) foci that mark the ends of the extended bridge and in a ring (arrow; also in Fig. S3 A). Mps3-GFP (green) colocalizes with Ndc1-mCherry (red) at toroids (SLJ5496). Schematics illustrate protein distribution at SPBs. (E) Top-down and side-on view from wild-type (SLJ10001) and pom152Δ mps2Δ (SLJ12620) strains by SIM showing YFP-Kar1 (green). (F) Topology of Ndc1, Mps2, and Mps3. Nbp1 interacts with the nuclear side of the membrane via its amphipathic helix (Kupke et al., 2011). Bbp1 is soluble (Schramm et al., 2000). Because acceptor photobleaching FRET is sensitive to protein abundance, we determined levels of Mps2-mT2 (SLJ8065), Nbp1-mT2 (SLJ12020), Bbp1-mT2 (SLJ11903), Mps3-mT2 (SLJ8835), and Ndc1-mT2 (SLJ7941) in asynchronously growing haploid cells at the SPB relative to the amount of Spc42-YFP. Long bars depict average values, which are listed with SEM based on the number of points shown. P values were calculated using two-sided Student’s t test; all are significant (P < 0.0001) except for Nbp1-mT2 and Bbp1-mT2. (G) Binding between Mps3 and SPIN components was analyzed at the SPB using acceptor photobleaching FRET in asynchronously growing cells. Average FRET efficiency in the number of cells analyzed is listed along with SEM. Negative FRET values are most likely due to bleaching of the donor, since we excluded cells in which the SPBs moved. P values were determined using the two-sided Student’s t test compared with the donor-only control. ***, P = 0.0005; ****, P < 0.0001. (H–K) Individual SIM (H and J) and averaged (I and K) images showing localization of Ndc1-YFP (red) and the distribution of Mps3-mT2 (H and I) or Mps2-mT2 (J and K; green) in wild-type (SLJ10636; SLJ11171), pom152Δ (SLJ11071; SLJ12370), and pom152Δ mps2Δ/pom152Δ mps3Δ (SLJ10535; SLJ11173). (L and M) Distribution of Mps3-mT2 (green) along with Ndc1-YFP (red) in individual (L) or averaged (M) SIM images of wild-type (SLJ12772) and mps2-381 (SLJ12616) cells grown at 23°C or shifted to 34°C for 3 h. (N) Top-down SPB view summarizing Mps3 and SPIN localization in wild-type cells and in mutants lacking MPS2 or MPS3. Bbp1 localizes near the bridge in wild-type cells (Burns et al., 2015), but the Mps3 bridge tether is unknown. While Kar1 has been proposed to be a KASH-like protein, it contains a single amino (F) acid in the luminal space. Bars, 100 nm unless indicated otherwise.

