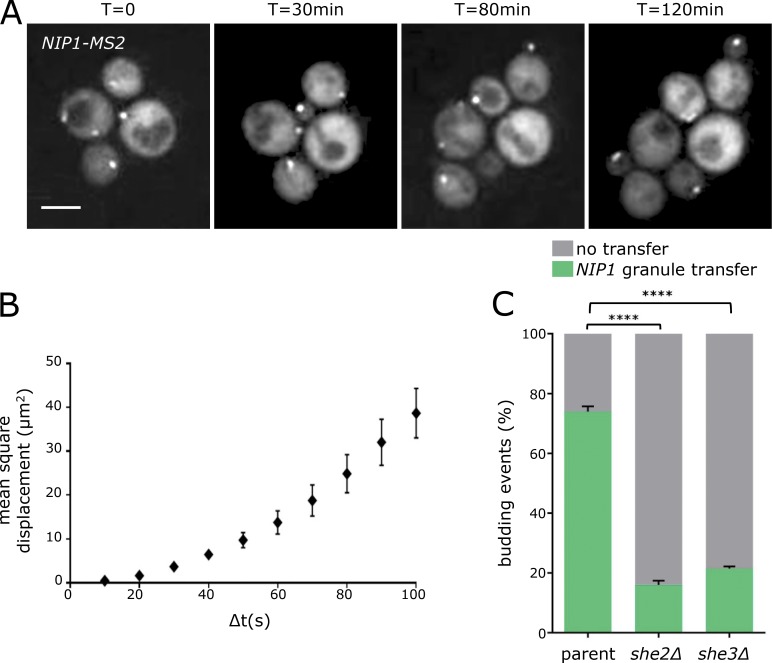
Figure 6.
Granules move to the daughter cell upon division. (A) Z-stacked images of a NIP1-MS2 strain imaged over a 2-h period using a microfluidic system. Bar, 4 µm. (B) MSD analysis of NIP1-MS2 granules, where displacement over increasing time intervals is evaluated. Error bars = ±SD. (C) Chart showing the percentage of budding events where a NIP1-MS2 granule enters the daughter cell in wild-type, she2Δ, and she3Δ strains (n = 3, >100 cells per repeat). ****, P < 0.0001. Error bars = +SD.

