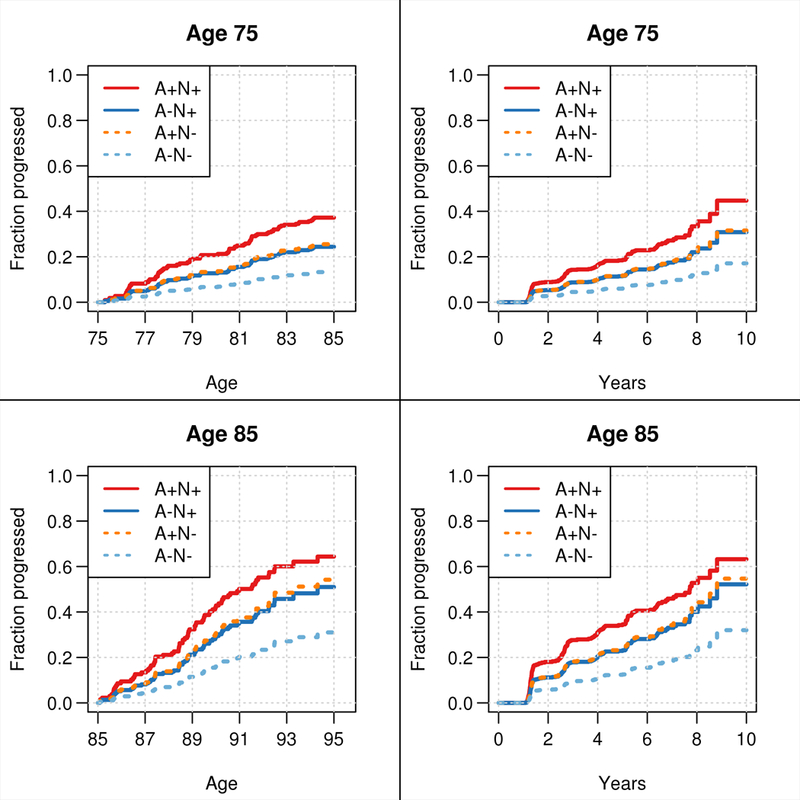
Figure 1.

Probability of MCI or dementia over time accounting for the competing risk of death. Cause specific survival models were fit using age as the time scale (left column) and using years from imaging as the time scale (right column). Probabilities depend on age and ages 75 and 85 were chosen to illustrate this dependence. For simplification of presentation, estimates are shown averaged over sex and for an individual with some college education (i.e., ≥13 years).
