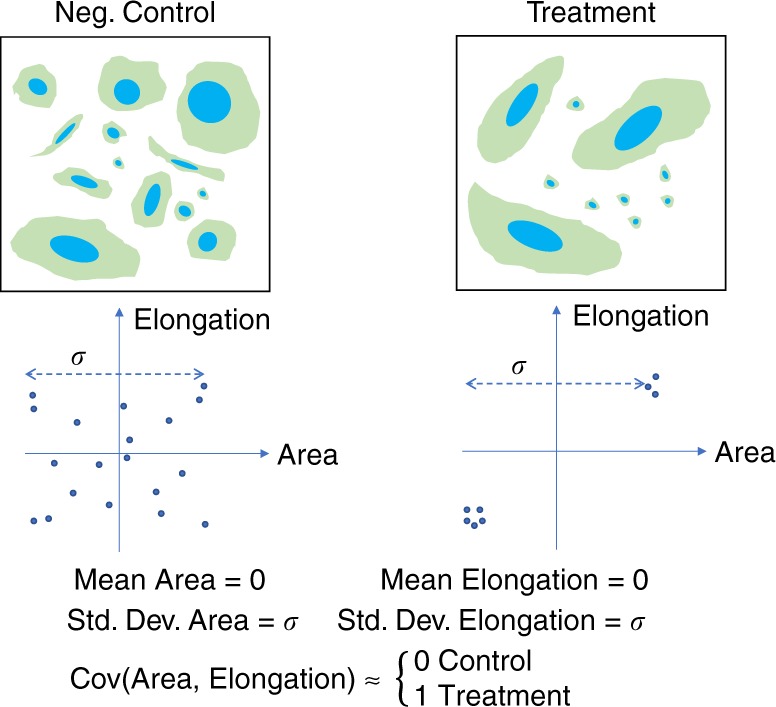
Fig. 1.

Features’ covariance can capture cell phenotypes better than feature averages or dispersion. In this synthetic example, the negative control sample (on the left) consists of cells displaying heterogeneous morphologies. The treatment, on the other hand, shows two distinct subpopulations. In both cases, the scatter plot helps to see that the mean and standard deviation of both measured cell features (area and elongation) are equivalent in the two cases. However, the two features positively correlate in the treatment condition as opposed to the control. In such a case, the covariance can distinguish the phenotypes better than simple averages (e.g., means and medians) and measures of dispersion (e.g., standard deviations and median absolute deviations)
