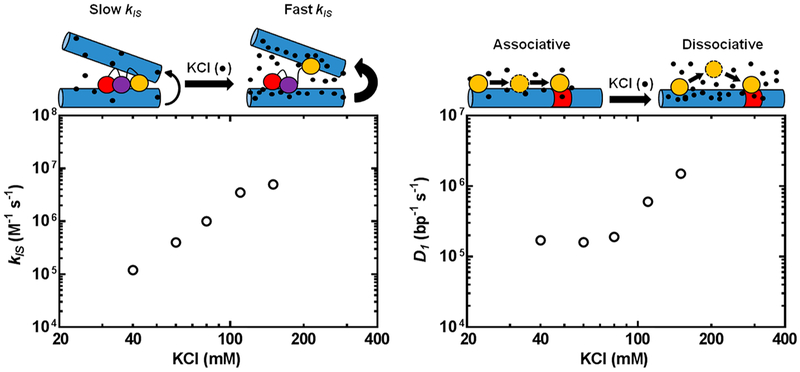
Figure 19.
Salt dependence of the apparent rate of target-site location by Egr-1 changes the relative contributions of the 1D, 3D, and IS pathways for target-site location, (a, left panel) The IS rate (kIS) increases in a log–linear fashion with salt, which was attributed to salt-enhanced release of Egr-1 from competitor DNA. (b, right panel) The diffusion constant for 1D translocation increases in a biphasic fashion with respect to salt concentration.3 The salt-resistant region was attributed to associative DNA translocation, and the salt-enhanced region was attributed to salt-enhanced dissociative transfers. Adapted with permission from ref 3. Copyright 2014 Oxford University Press.

