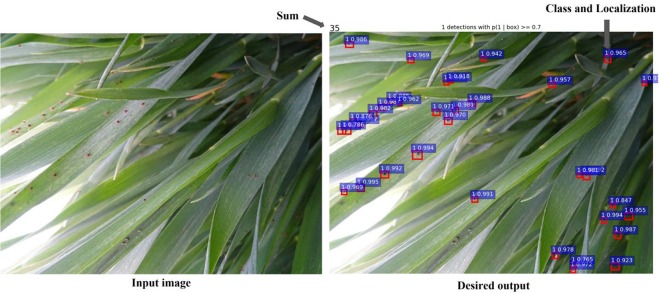
Figure 1.
Classification and localization of wheat mites. Our method aims to detect both the classification and localization of wheat mites. At the same time, this method outputs the total number of wheat mites in the original images. The left graph shows the case of original image, while the right one illustrates classification and localization of wheat mites. Here, the location of wheat mite in the image is shown as a red bounding box containing the identified wheat mites, the possibility of detected bounding box is shown in blue box, and the total number of 35 detected wheat mites is also shown in the right graph.

