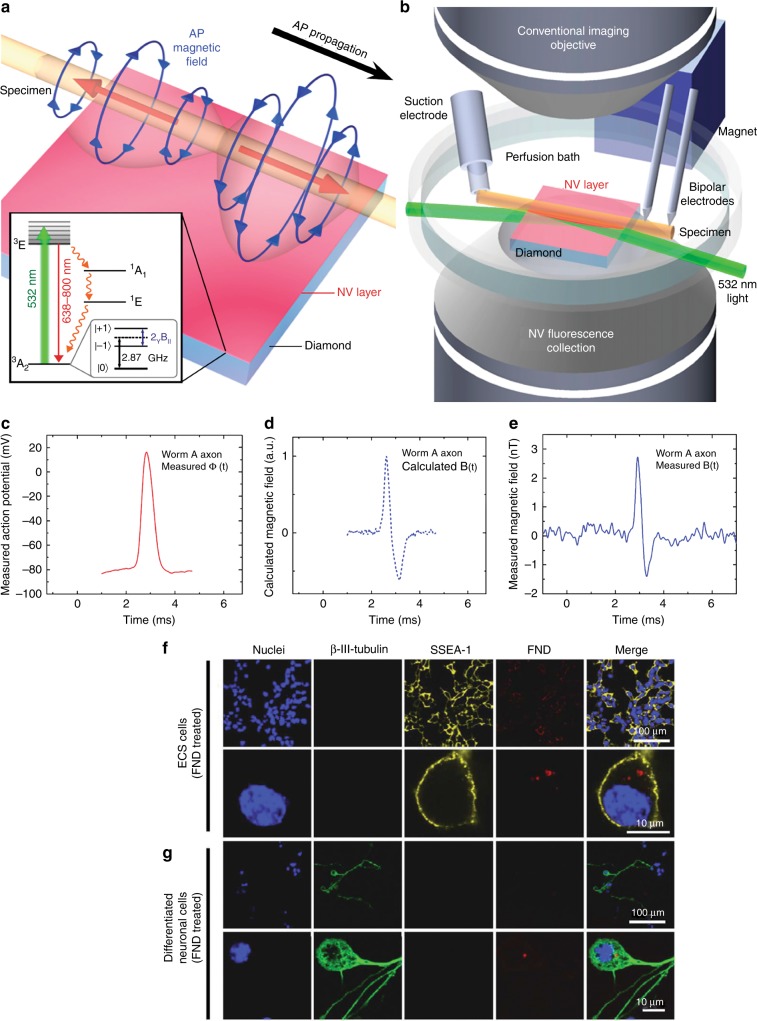
Fig. 7. Experimental overview of the measurement of action potential (AP) with NV centres97 and detection and location of nanodiamonds (NDs) in ECS cells107.
a A schematic of the bipolar azimuthal magnetic field associated with a giant axon. Inset: the energy-level diagram of an NV− centre. b A schematic of the microscope implemented for the magnetic measurements. c Measured AP voltage with the electrophysiology measurement. d Calculated magnetic field. e Measured magnetic field with NV− centres. f ECS cells treated with NDs. In red is the fluorescence intensity of NDs excited with light at a wavelength of 580 nm. The emission is collected in the wavelength range of 600–700 nm. In blue is the nucleus of the cell, and in yellow, the SSEA-1. g Differentiated neural cells. Fluorescent NDs are observed in the cytoplasm of undifferentiated ECS and differentiated cells

