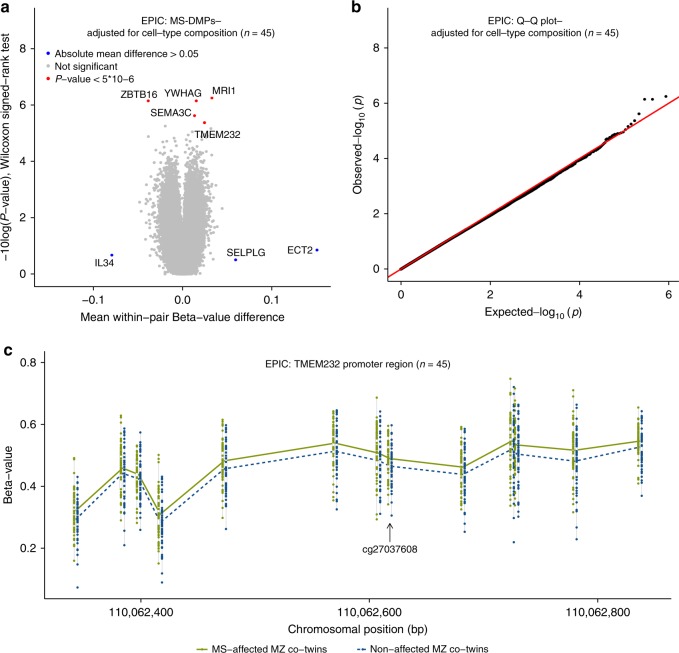
Fig. 2.
DNA methylation changes associated with the clinical manifestation of MS. Results of the differential DNA methylation analysis including the EPIC array data of the 45 MZ twin pairs clinically discordant for MS. a Volcano plot of the p-values resulting from the nonparametric two-tailed Wilcoxon signed-rank test against the mean within-pair β-value difference for each CpG. Data were adjusted for cell-type composition. b Q-Q plot of the p-values resulting from the nonparametric two-tailed Wilcoxon signed-rank test shown in Fig. 2a. Data were adjusted for cell-type composition. Within-pair β-value difference (Δβ-value) = clinically MS-affected MZ co-twin—non-affected MZ co-twin. c Overview of the TMEM232 promoter region. Data are presented as Tukey boxplots including the individual data points that represent the (adjusted) β-values of the significant MS-associated differentially methylated CpG position (MS-DMP) cg27037608 and 12 neighboring CpGs present on the EPIC array. The lines connect the mean methylation values of each CpG site for the MS-affected and clinically non-affected MZ co-twins separately. Boxplots represent the interquartile range or IQR (bottom and top of the box) and 1.5 times the IQR (whiskers). Source data are provided as a Source Data file. n = number of twin pairs

