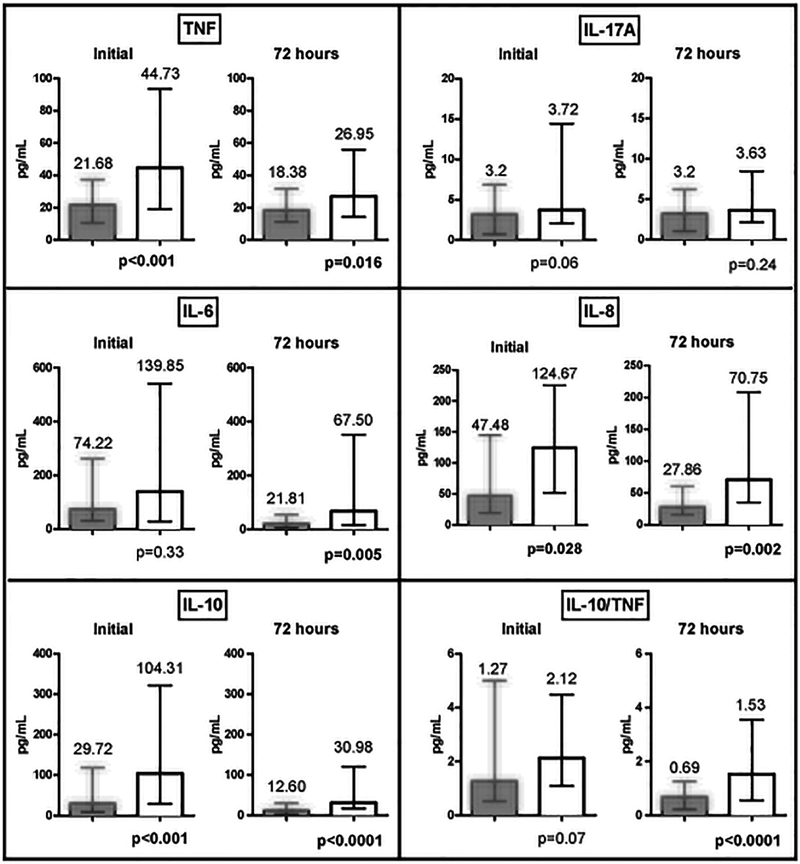
Figure 1: Cytokine Profile at Initial Presentation of Bacteremia and 72 Hours After Receiving Effective Treatment Grouped by Day 4 Outcome.
Abbreviations: IL, interleukin; TNF, tumor necrosis factor; Median reported, error bars represent IQR, Wilcoxon rank sum test. Dark grey bars represent resolving SAB group (TNF initial n=138; TNF 72 hour n=146; IL-6 initial n=94; IL-6 72 hour n=100; IL-8 initial n=94; IL-8 72 hour n=104; IL-17A initial n=121; IL-17A 72 hour n=118; IL-10 initial n=131; IL-10 72 hour n=132). White bars represent persistent SAB group (TNF initial n=46; TNF 72 hour n=43; IL-6 initial n=25; IL-6 72 hour n=26; IL-8 initial n=26; IL-8 72 hour n=27; IL-17A initial n= 44; IL-17A 72 hour n= 41; IL-10 initial n= 45; IL-10 72 hour n= 42).

