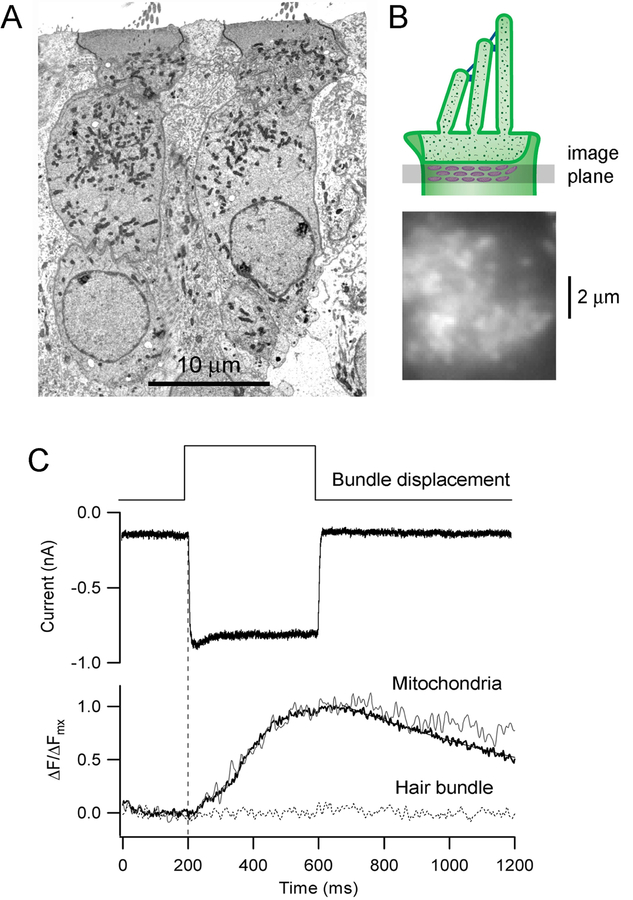
Fig. 4.
Ca2+ uptake into the sub-cuticular plate mitochondria. A. Transmission electron micrograph of two OHCs in a P10 rat organ of Corti, showing the high density of mitochondria in the supranuclear region of cytoplasm. B. Top depicts the imaging plane for measuring the Ca2+ fluorescence in mitochondria filled with calcium dye Rhod2; below shows a top view of the OHC with the bright regions being mitochondrial densities. C. MET current (holding potential of −84 mV) and mitochondrial Ca2+ fluorescence in an OHC in response to hair bundle deflection. The mitochondrial fluorescence, expressed as ∆F/ ∆Fmax, illustrates a single cell (noisy trace) and an average of five different cells (bold trace), showing that Ca2+ accumulates during the bundle stimulus. The dotted line represents imaging of the hair bundle, where no signal was detected. Results taken from (Beurg et al., 2010).

