
Fig. 5.
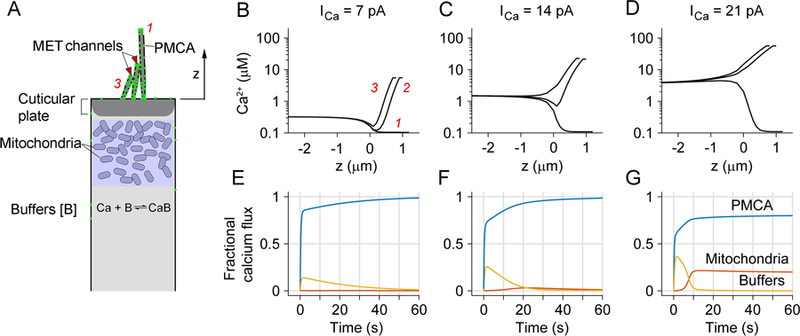
Modeling Ca2+ homeostasis in an OHC. A. Schematic hair cell showing components of the model, including Ca2+ influx through MET channels at tips of second and third row stereocilia, buffering by mitochondria and cytoplasmic Ca2+ binding proteins, and extrusion via PMCA in stereocilia. The height of the tallest stereocilium above top of cell is z = 4 µm for an apical OHC and 1 µm for a basal OHC; the number of OHC tip links is 54 (apex) and 72 (base). B, C, D. Simulations of Ca2+ changes during sustained loads of 7 pA, 14 pA and 21 pA flowing in through the MET channels in the bundle of a basal OHC. In each plot, the time course of cytoplasmic [Ca2+] is shown as a function of distance from the top of the cell, z = 0, for the three rows of stereocilia, indicated in B as red numbers, 1, 2 and 3 for first, second and third row. Negative values of z denote distances below top of cell. These are the steady-state concentrations at the end of the 60 s stimulus. Note that for larger loads, [Ca2+] at the top of the cell is 1.5 to 4 µM. E, F, G. Fraction of Ca2+ that is distributed between calcium buffers (yellow), PMCA pumps (blue) and mitochondria (red) for the three Ca2+ loads. Ca2+ is initially bound by buffers, but then unloaded by PMCA pumps, but for the largest influx, some accumulates in the mitochondria.