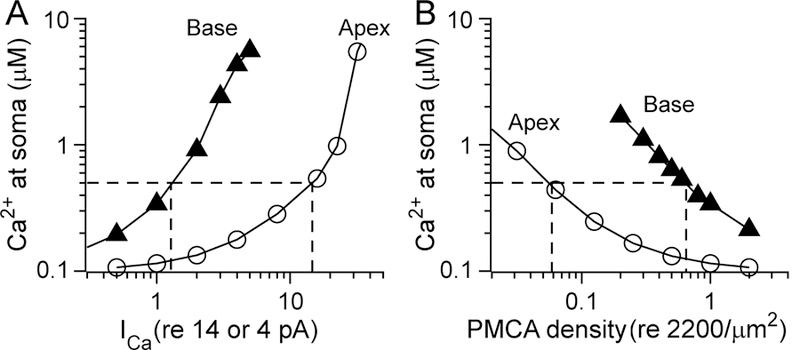
Fig. 6.

Modeling of Ca2+ homeostasis in apical and basal OHCs. A. [Ca2+] at the soma as a function of varying the Ca2+ current (ICa) for low-frequency apical OHC (open circles) and high frequency basal OHC (filled traingles). ICa is plotted on the abscissa, scaled to a standard value of 4 pA (low-frequency apex) and 14 pA (high-frequency base). B. [Ca2+] at the soma as a function of varying PMCA density, scaled to its standard value of 2000/µm2, distributed over a bundle area of ratio of ~4:1 for low-frequency to high-frequency region. In all cases, the [Ca2+] at the soma increases with larger Ca2+ currents (i.e. load) and with smaller PMCA density. However, high-frequency basal OHCs are much more susceptible to changes in these parameters. In both (A) and (B), dashed lines indicate the threshold [Ca2+] 0f 0.5 µM at which mitochondria will start to take up Ca2+ (Xu et al., 1997)
