Figure 3:

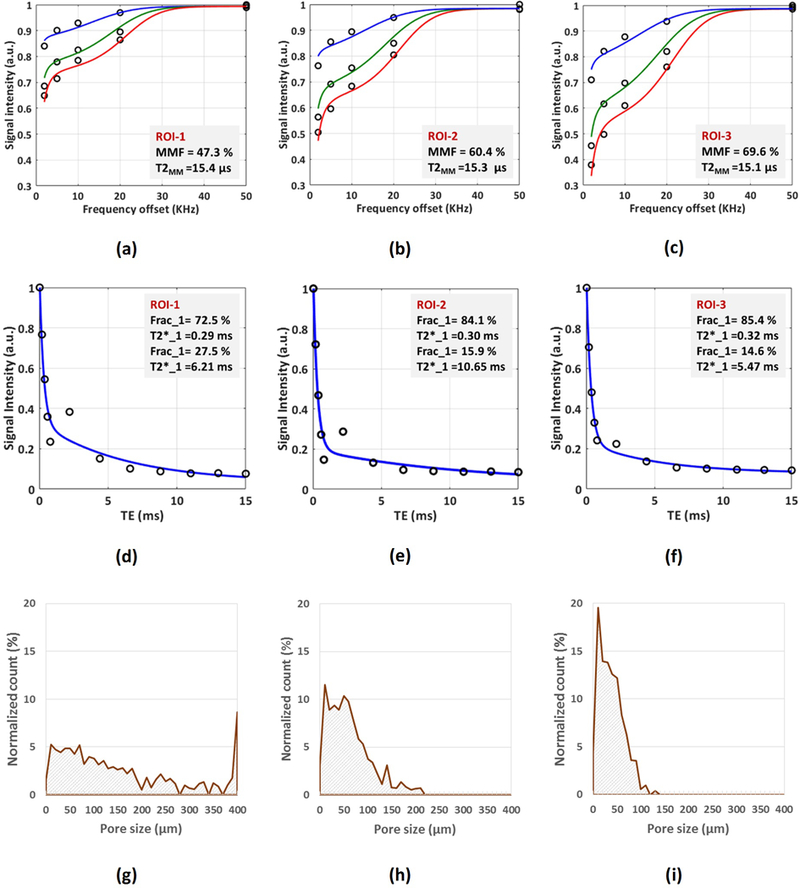
MRI-based and histomorphometric analyses for three exemplary ROIs at three different cortical bone layers (Fig.1). (a-c) The two-pool MT modeling analyses in (a) ROI-1, (b) ROI-2, and (c) ROI-3 using three pulse saturation powers (500˚ in blue, 750˚ in green, and 1000° in red) and five frequency offsets (5, 10, 20, 50 kHz). MMF and T2MM refer to macromolecular fraction and macromolecular T2, respectively. (d-f) Bi-component exponential fitting of the T2* decay within (d) ROI-1, (e) ROI-2, and (f) ROI-3. The oscillating actual data points indicates the presence of fat particularly in ROI-1 and ROI-2 near the endosteum. (g-i) Pore size distribution obtained from histomorphometric analyses within (g) ROI-1, (h) ROI-2, and (i) ROI-3. Histomorphometric porosity and pore size for ROI-1 to −3 were 33.1, 13.9, and 7.1% and 221, 83, 49 μm, respectively. The μCT-based porosity was 21.2, 8.2, and 1.7% for ROI-1 to −3, respectively.
