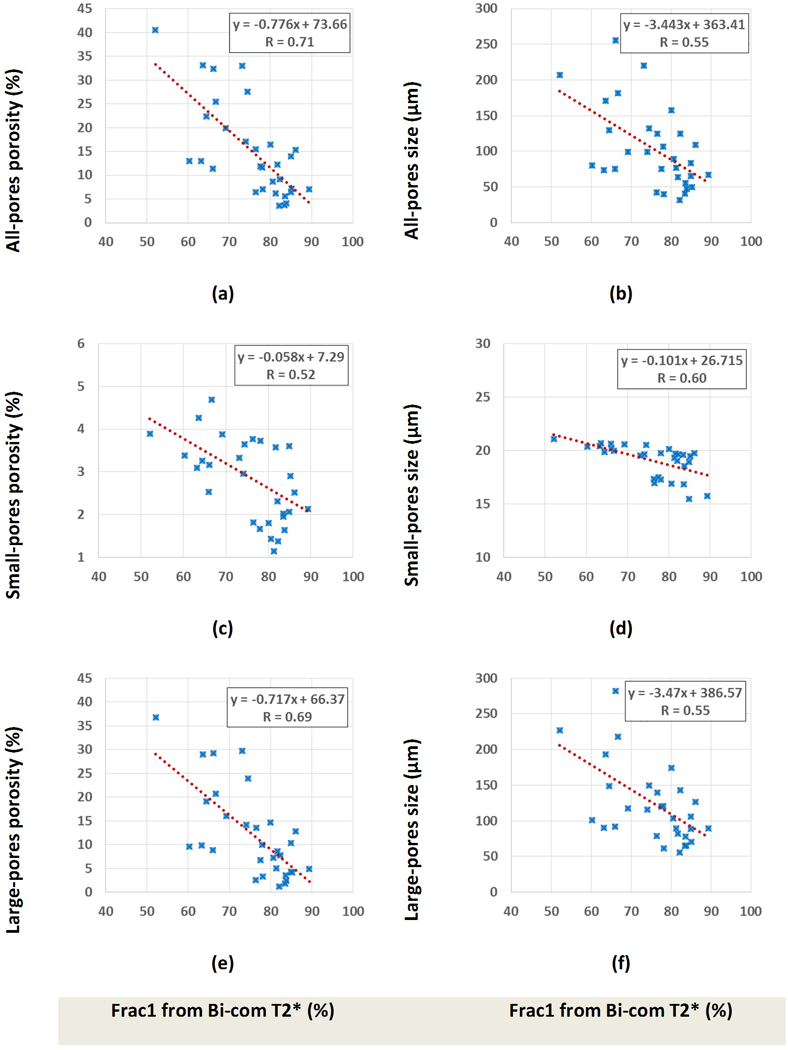
Figure 6:

Scatter plot and linear regressions of bone porosity and pore size on short component fraction (Frac1) when considering (a,b) all pores, (c,d) only small pores, and (e,f) only large pores. Significance levels for these correlations were below 0.01, as measured using non-parametric bootstrap (with resampling by specimen) to adjust for within-specimen dependence.
