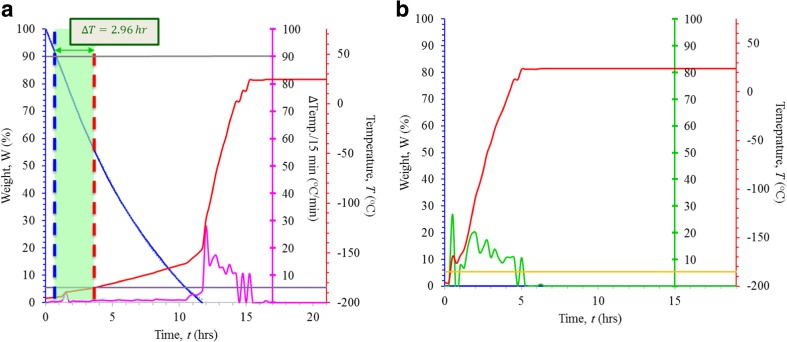
Fig. 3.
a Results of the medium rate-loss trial. The decrease in LN2 weight (as a percentage of starting weight; blue line), and the corresponding increase in temperature (°C) over time (measured in hours; red line) are shown. Thresholds for detecting a 10% weight loss and rise in temperature to − 185 °C are indicated by the gray and purple lines, respectively. The interval between the detection of 10% weight drop and a rise in temperature to − 185 °C was approximately 3 h and is indicated as the distance between the dashed blue and red lines. The rate of weight loss can be described by the formula W = 0.4447 t2–13.661 t + 100.07 (where W represents weight, measured as a percentage of total and t represents time, measured in hours; R2 = 0.9997). The rate of change of temperature, measured in 15-min intervals and recorded as °C/min, is shown in magenta. b Results of the rapid rate-loss trial. Thresholds for detecting a rise in temperature to − 185 °C are indicated by the yellow lines. The rate of change of temperature, measured in 15-min intervals and recorded as °C/min, is shown in green

