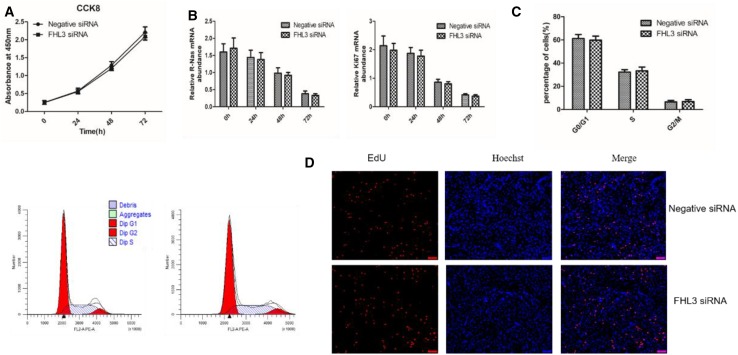
Fig. 3.
Effects of FHL3 knockdown on the proliferation of chicken satellite cells. a Cell proliferation rate was estimated by measuring the number of viable cells at 0, 24, 48 and 72 h after transfection. Absorbance at 450 nm on the y-axis represented the number of viable cells. b The mRNA expression of Ki67 and N-Ras at 0, 24, 48 and 72 h detected by RT-qPCR. c Cell cycle was analyzed through flow cytometry. d Edu assays for cells transfected with negative or FHL3 siRNA. EdU (red) fluorescence indicates proliferation. Nuclei are indicated by Hoechst (blue) fluorescence. All photomicrographs are at 100 × magnification. Data are expressed as means ± sem (N = 3)

