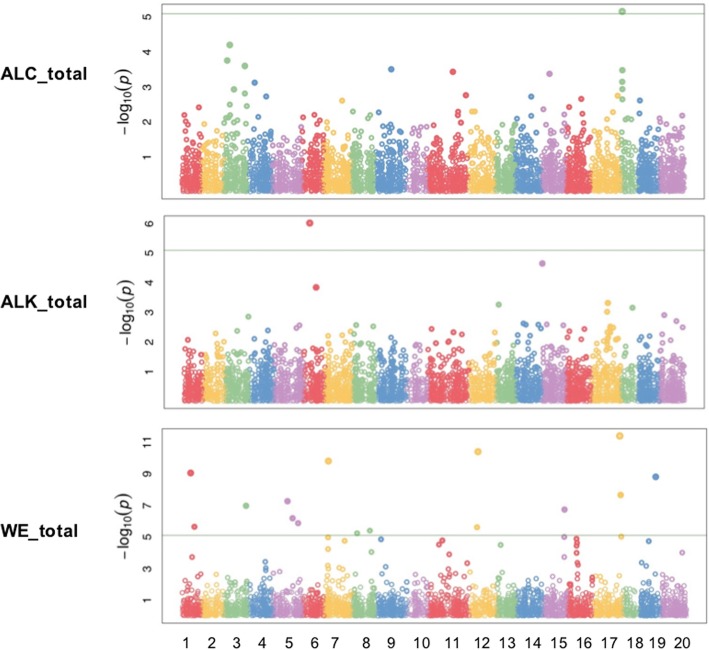
Fig. 2.
Manhattan plots of GWAS results showing significant SNPs associated with total wax esters (WE_total), total alkanes (ALK_total) and total primary alcohols (ALC_total) in spring Camelina sativa diversity panel. X-axis shows the distribution of SNPs across 20 chromosomes while y-axis shows Bonferroni corrections threshold. The SNPs in triangle, rectangular and circle shared significance among different trait

