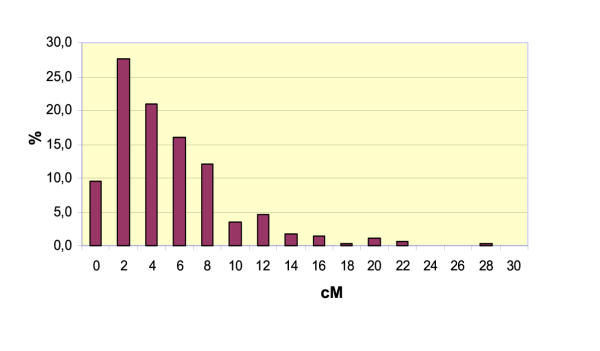
Figure 3.
Distribution of the 281 intervals between adjacent markers on the F2 genetic map of M. truncatula. X-axis: genetic distance in Kosambi cM. Y-axis: frequency of intervals (%). The average distance between two markers is 4.4 cM with a standard deviation of 4.3 cM. 90% of the markers are closer than 10 cM.

