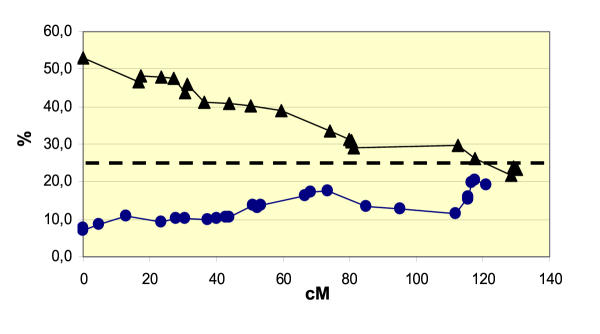
Figure 4.
Segregation distortion of the female and male markers along linkage group 3 of the overall F2 genetic map of M. truncatula. Circles and triangles refer to female and male alleles respectively. X-axis: genetic distance from the top of the linkage group in Kosambi cM. Y-axis: frequency (%) of segregation of female and male alleles in the mapping population. A dominant marker is considered to be a male marker if the recessive allelic form is male (and the same for the female markers). If no distortion occurs, the segregation value should be close to 25% for both male and female markers (dashed line).

