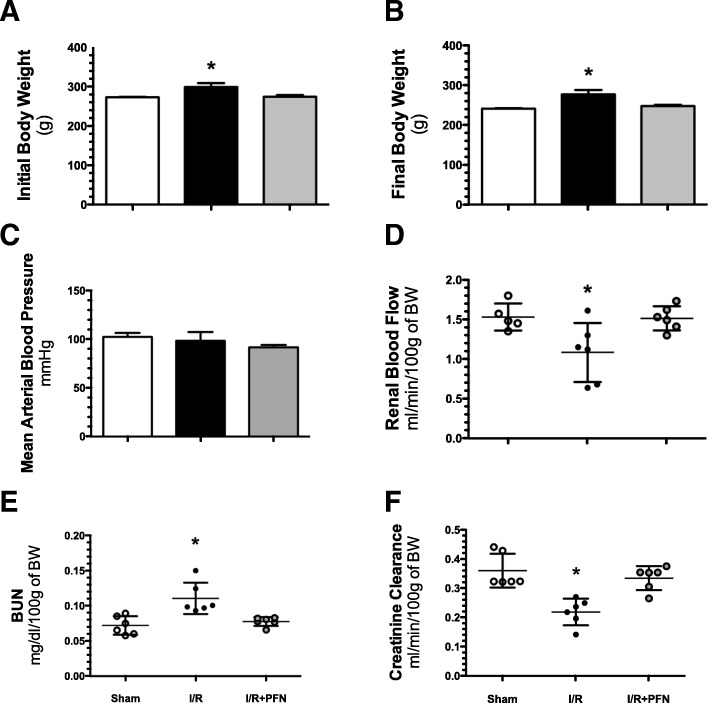
Fig. 1.
Renal dysfunction is prevented by pirfenidone. a) Initial body weight, b) final
body weight (c) mean arterial blood pressure, (d) renal blood flow, (e) BUN and (f) creatinine clearance. The sham group is represented by white bars or dots, the I/R group by black bars or dots and the IR + PFN group by gray bars or dots. Six rats per group were studied. Data are shown as the means ± SD. * = p < 0.05 vs. sham and I/R + PFN groups. The significance of the differences between groups was assessed by ANOVA using the Bonferroni correction for multiple comparisons

