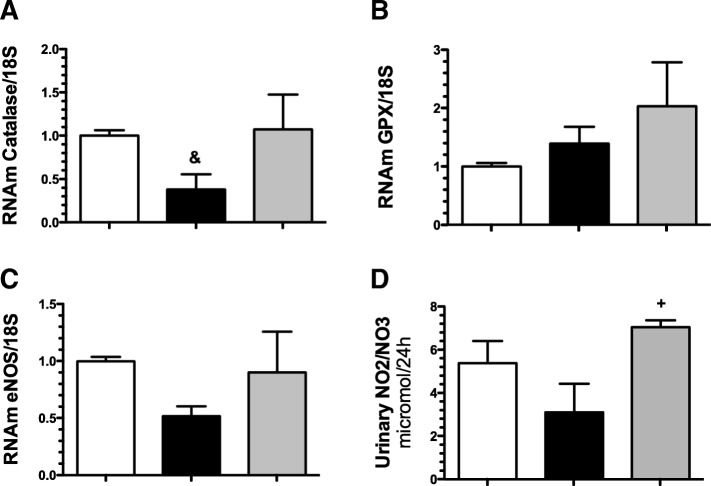
Fig. 4.
Mechanisms involved in renoprotection conferred by pirfenidone. a) Catalase mRNA levels, b) GPX mRNA levels, c) eNOS mRNA levels, d) urinary NO2/NO3 excretion The sham group is represented by white bars; the I/R group, by gray bars; and the IR + PFN group, by black bars. Six rats per group were studied. The results are presents as mean of two different measurements. Data are shown as the means ± SD. + = p < 0.05 vs. I/R, & = p < 0.05 vs. sham group. The significance of the differences between groups was assessed by ANOVA using the Bonferroni correction for multiple comparisons

